


Fig. B.1.
Download original image
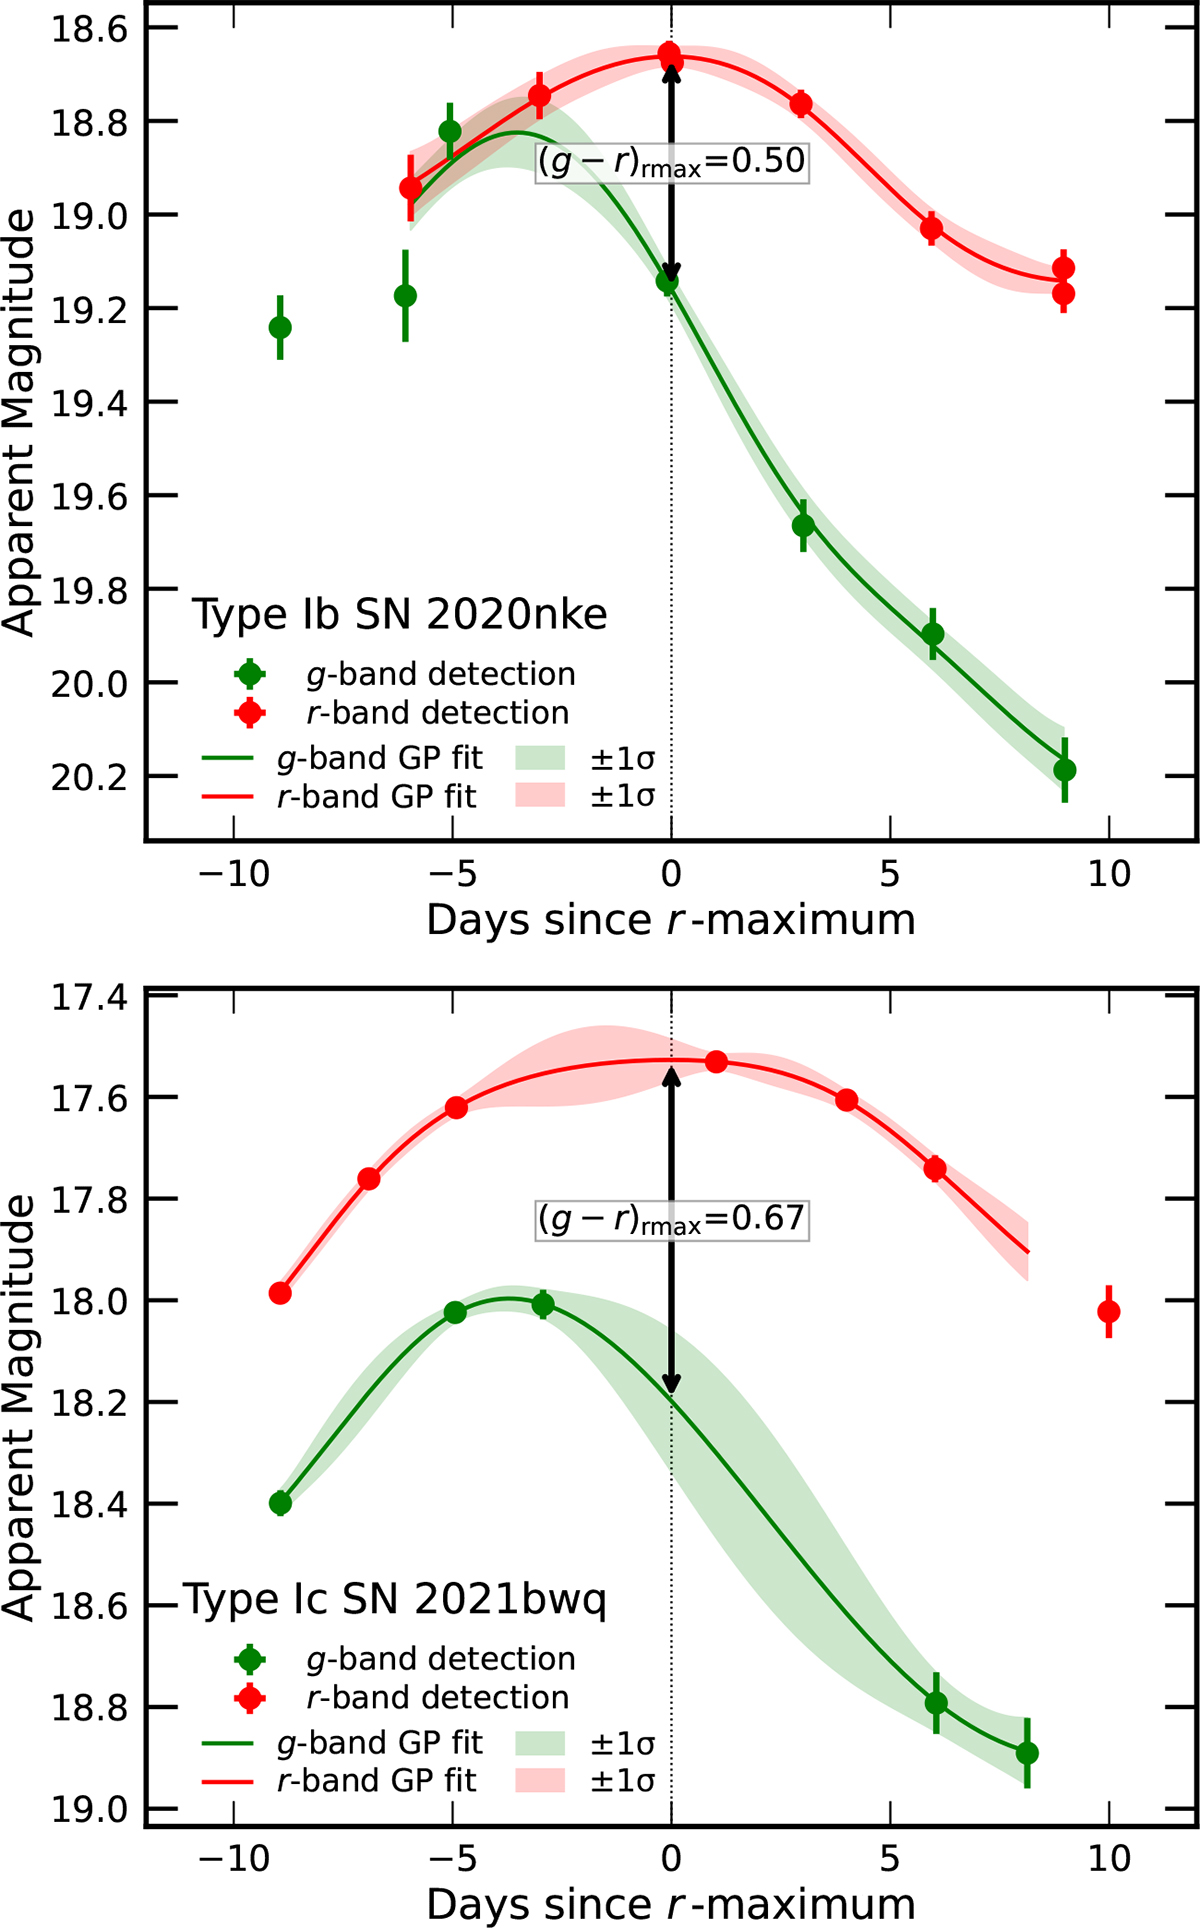
Light curves in g- and r-bands for one SN Ib (SN 2020nke) and one SN Ic (SN 2021bwq), of which (g − r)rmax values after Milky Way reddening and K-correction are close to the mean values of SNe Ib and Ic without narrow lines. The data points show the observation, the solid lines represent the Gaussian Process fits, and the shaded regions indicate the 1-σ uncertainties. The black arrows show the determined (g − r)rmax values. The x-axis represents days since the r-band maximum, determined from the fitted light curve.
Current usage metrics show cumulative count of Article Views (full-text article views including HTML views, PDF and ePub downloads, according to the available data) and Abstracts Views on Vision4Press platform.
Data correspond to usage on the plateform after 2015. The current usage metrics is available 48-96 hours after online publication and is updated daily on week days.
Initial download of the metrics may take a while.