


Fig. 1.
Download original image
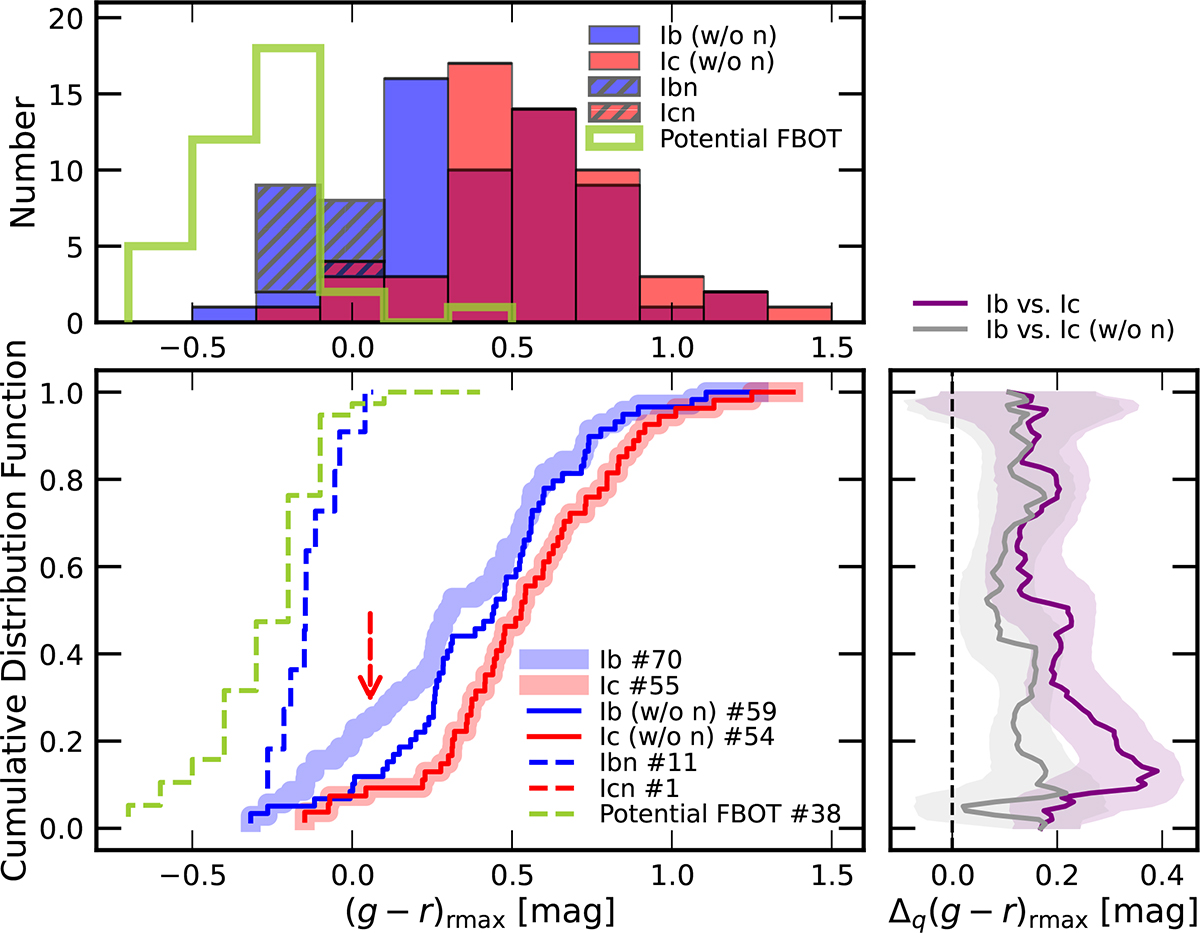
Histograms (upper left) and cumulative distributions (lower left) of g − r color at the time of r-band maximum, (g − r)rmax, for SNe Ib and Ic, those without narrow lines, SNe Ibn and Icn, and (potential) FBOTs from Ho et al. (2023). The contributions from SNe Ibn and Icn are marked differently as “//” hatching (upper left) and dashed lines (lower left). The lower right panel shows differences between the SNe Ib and Ic cumulative distributions as a function of a quantile (Δq(g − r)rmax), for the full sample and for the subsample without narrow lines. Positive values mean that SNe Ib are bluer than SNe Ic. Solid lines show the nominal differences, and shaded regions indicate the 1-σ bootstrap uncertainty. The vertical dashed line marks zero difference.
Current usage metrics show cumulative count of Article Views (full-text article views including HTML views, PDF and ePub downloads, according to the available data) and Abstracts Views on Vision4Press platform.
Data correspond to usage on the plateform after 2015. The current usage metrics is available 48-96 hours after online publication and is updated daily on week days.
Initial download of the metrics may take a while.