


Fig. 12.
Download original image
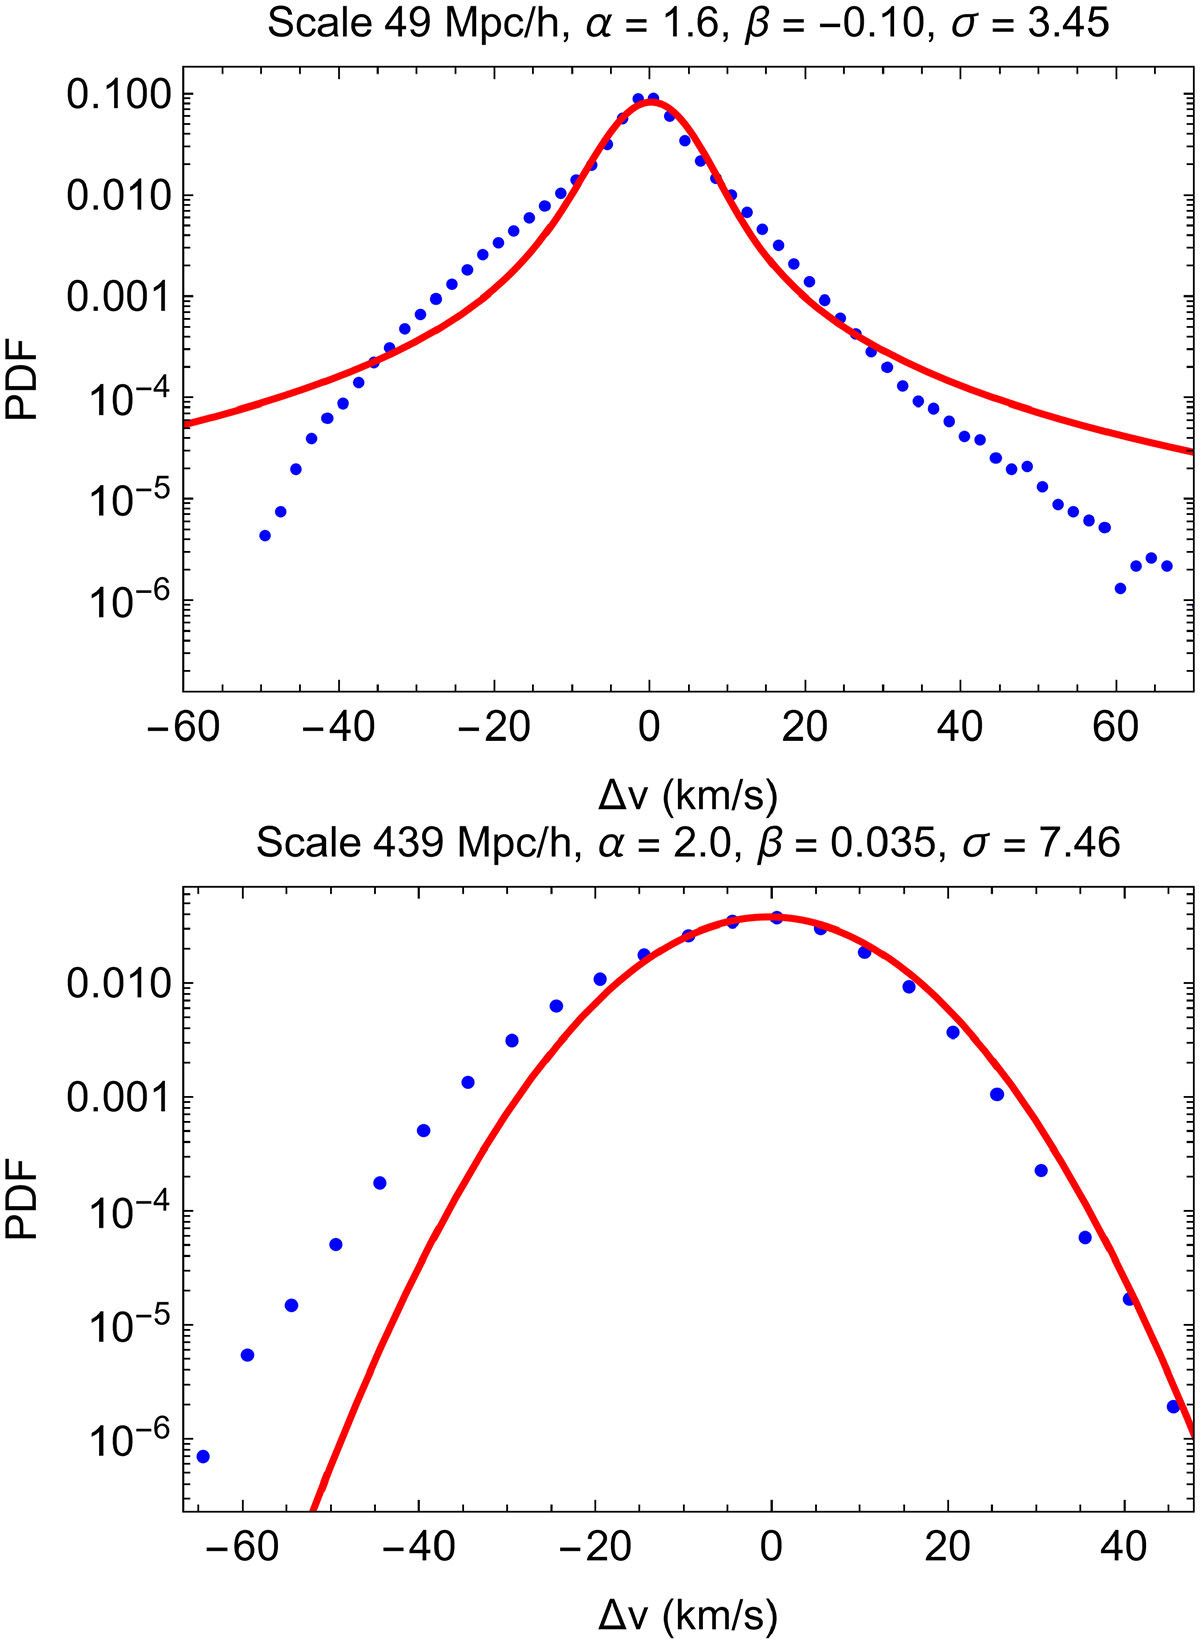
Probability density functions (PDFs) of velocity increments Δv at two separations within the scaling regime, computed from 1 154 634 increments. Top: 49 h−1 Mpc (α = 1.6, β = −0.10, σ = 3.45). Bottom: 439 h−1 Mpc (α = 2.0, β = 0.035, σ = 7.4). The blue points represent the empirical PDFs, while the red curves show the best-fit Lévy-stable distributions. At small separations, the PDFs display pronounced non-Gaussian heavy tails and a slight negative skewness. At larger separations, the stability parameter approaches α → 2, indicating a gradual convergence towards Gaussian statistics, although the empirical distribution still exhibits a broader extreme left tail.
Current usage metrics show cumulative count of Article Views (full-text article views including HTML views, PDF and ePub downloads, according to the available data) and Abstracts Views on Vision4Press platform.
Data correspond to usage on the plateform after 2015. The current usage metrics is available 48-96 hours after online publication and is updated daily on week days.
Initial download of the metrics may take a while.