


Fig. 11.
Download original image
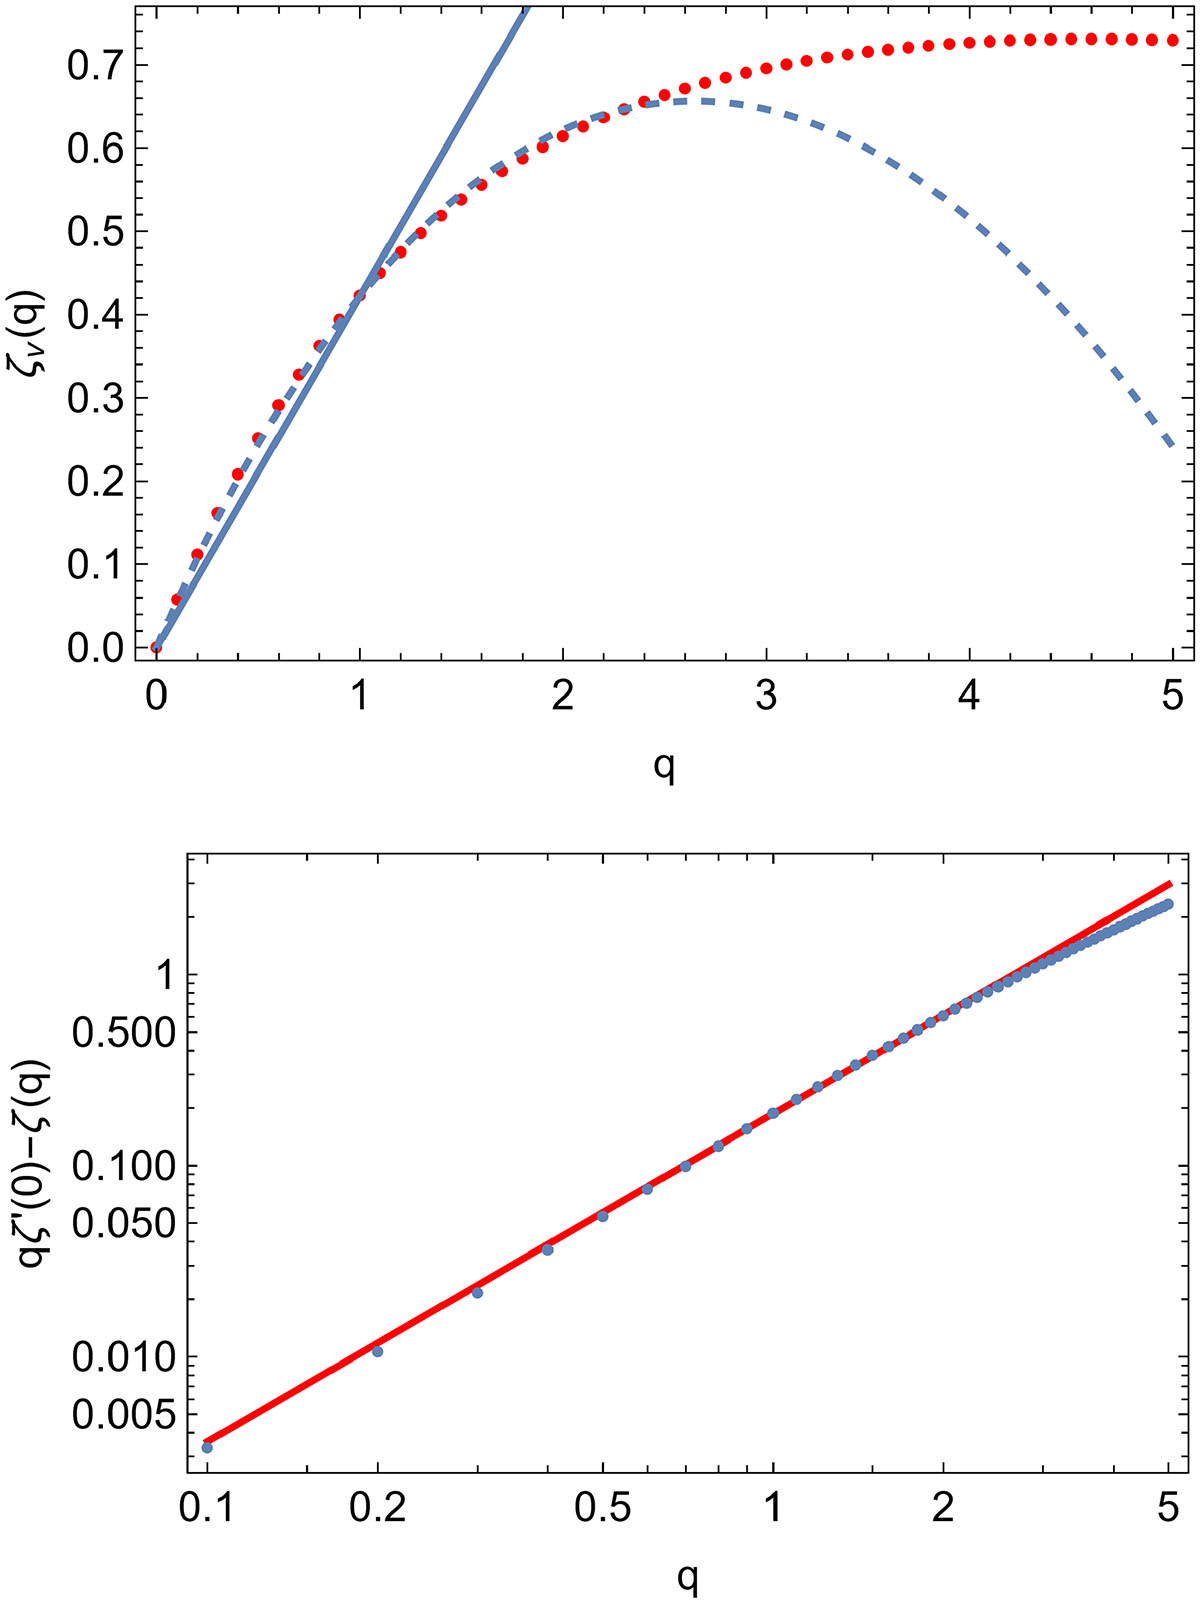
Top: ζv(q) scaling exponents (50 distinct values; red dots) for the second regime of the CF4 velocity field. The exponents show clear deviations from monofractal behaviour (indicated by the straight line of slope 0.42). The dashed curve corresponds to the best UM fit (H = 0.42, α = 1.7, C1 = 0.12). For q ≳ 2, a quasi-linear divergence appears, likely reflecting the increasing influence of a small number of high-gradient point pairs on the velocity statistics. Bottom: Empirical curve of qζ′(0)−ζ(q) as a function of q (blue dots) for the reconstructed CF4 velocity field, shown on a log–log plot, from which the UM parameters α and C1 are directly inferred. We obtain α ≈ 1.7 and C1 ≈ 0.12. For q ≳ 2, a weak linear divergence becomes visible, likely reflecting the increasing dominance of a small number of high-gradient point pairs in the velocity statistics.
Current usage metrics show cumulative count of Article Views (full-text article views including HTML views, PDF and ePub downloads, according to the available data) and Abstracts Views on Vision4Press platform.
Data correspond to usage on the plateform after 2015. The current usage metrics is available 48-96 hours after online publication and is updated daily on week days.
Initial download of the metrics may take a while.