


Fig. 8.
Download original image
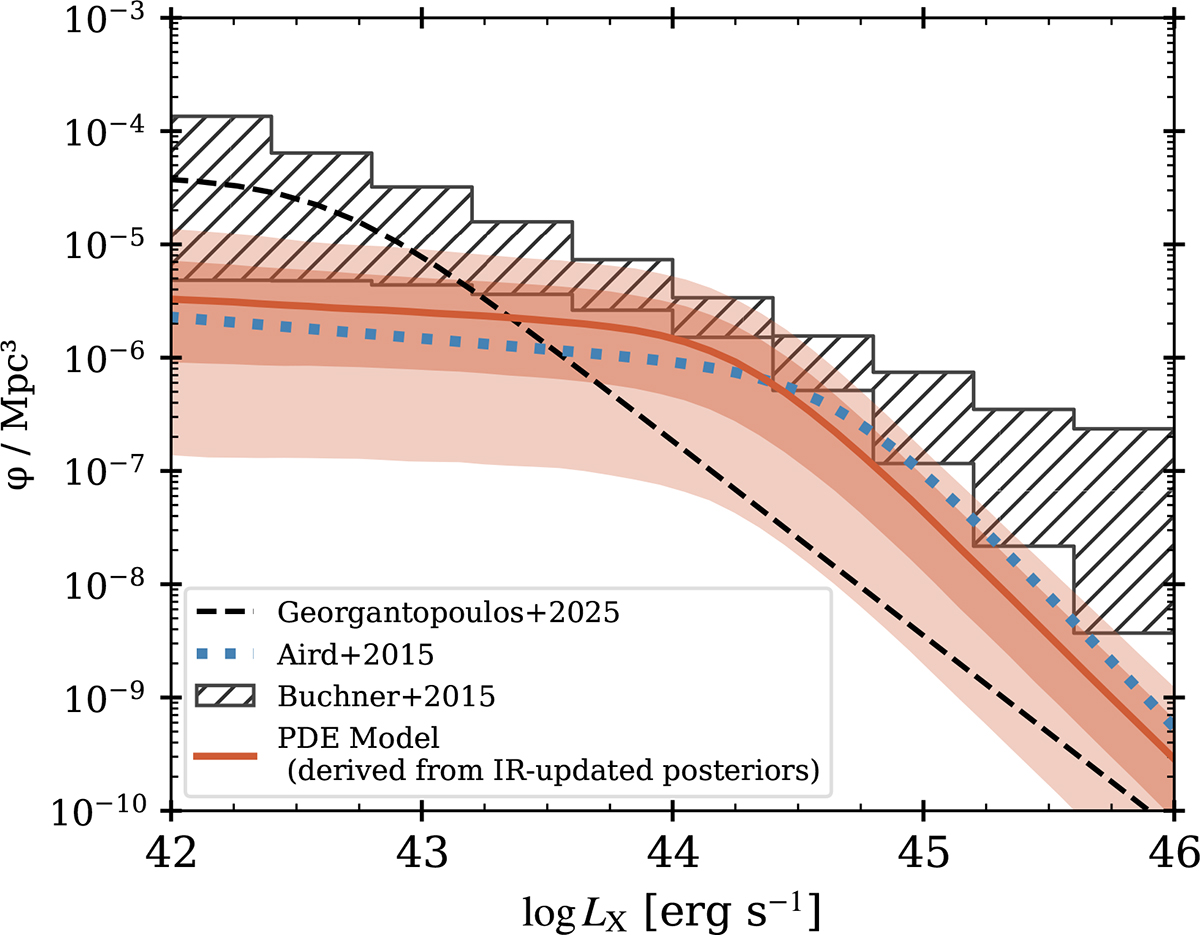
XLF for the CTK population (24 < log NH < 26). Red symbols show our result for the parametric XLF in the 3−6 redshift range. The solid red line corresponds to the median value and shaded areas are the 1σ (darker red) and 2σ (lighter red) uncertainties. The dashed black line is the XLF for CTK sources in the local universe (z < 0.05) derived by Georgantopoulos et al. (2025). The grey-hatched area is the non-parametric XLF in the 3.1−7 redshift range estimated by Buchner et al. (2015). The area shows the 90% confidence region. The dotted blue line corresponds to the Aird et al. (2015b) XLF for CTK AGNs in the 3−6 redshift range.
Current usage metrics show cumulative count of Article Views (full-text article views including HTML views, PDF and ePub downloads, according to the available data) and Abstracts Views on Vision4Press platform.
Data correspond to usage on the plateform after 2015. The current usage metrics is available 48-96 hours after online publication and is updated daily on week days.
Initial download of the metrics may take a while.