


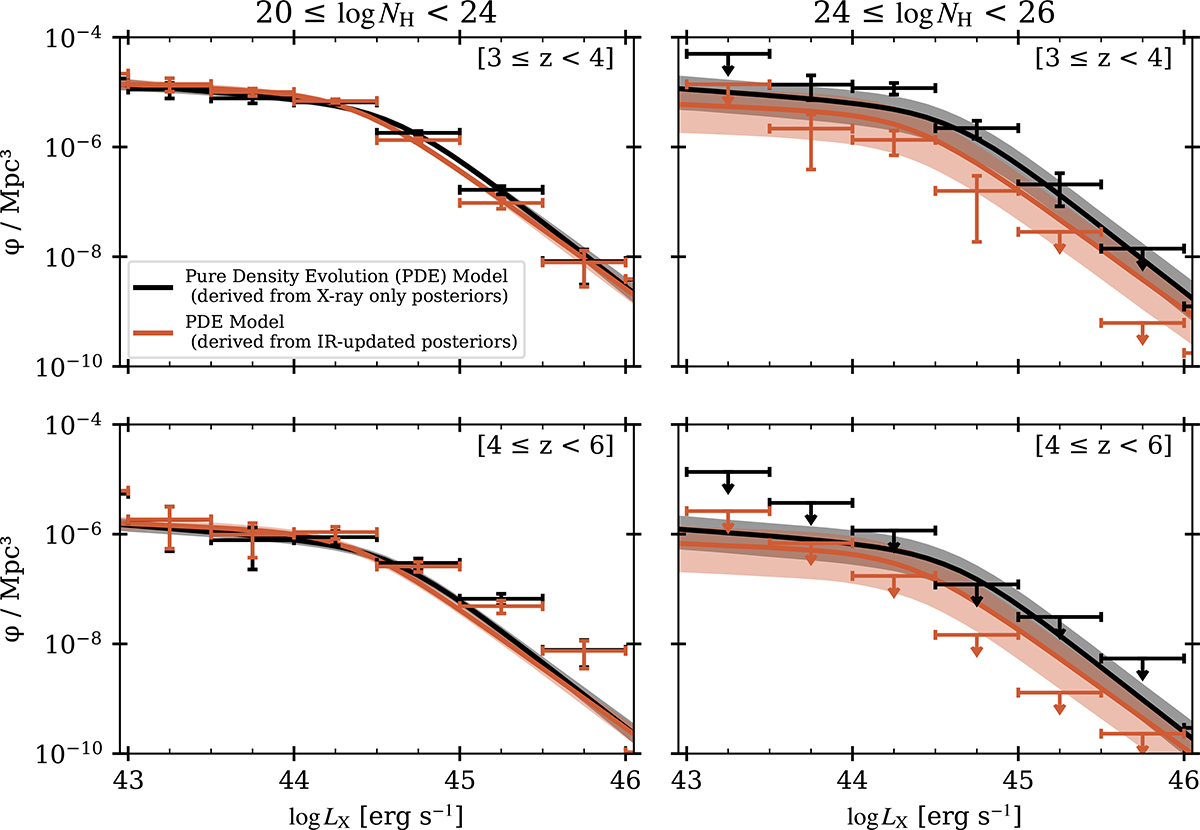
Fig. 7.
Download original image
XLAF for two redshift intervals (z = 3 − 4, top panels; z = 4 − 6, bottom panels) and two hydrogen column density ranges (log NH = 20 − 24, left panels; log NH = 24 − 26, right panels). Black lines and grey shaded regions indicate the results for the parametric XLAF obtained from the X-ray-only posteriors, while red lines and shaded regions correspond to those derived using the IR luminosity priors. The corresponding binned XLAFs were derived using the Miyaji et al. (2001) method.
Current usage metrics show cumulative count of Article Views (full-text article views including HTML views, PDF and ePub downloads, according to the available data) and Abstracts Views on Vision4Press platform.
Data correspond to usage on the plateform after 2015. The current usage metrics is available 48-96 hours after online publication and is updated daily on week days.
Initial download of the metrics may take a while.