


Fig. 4.
Download original image
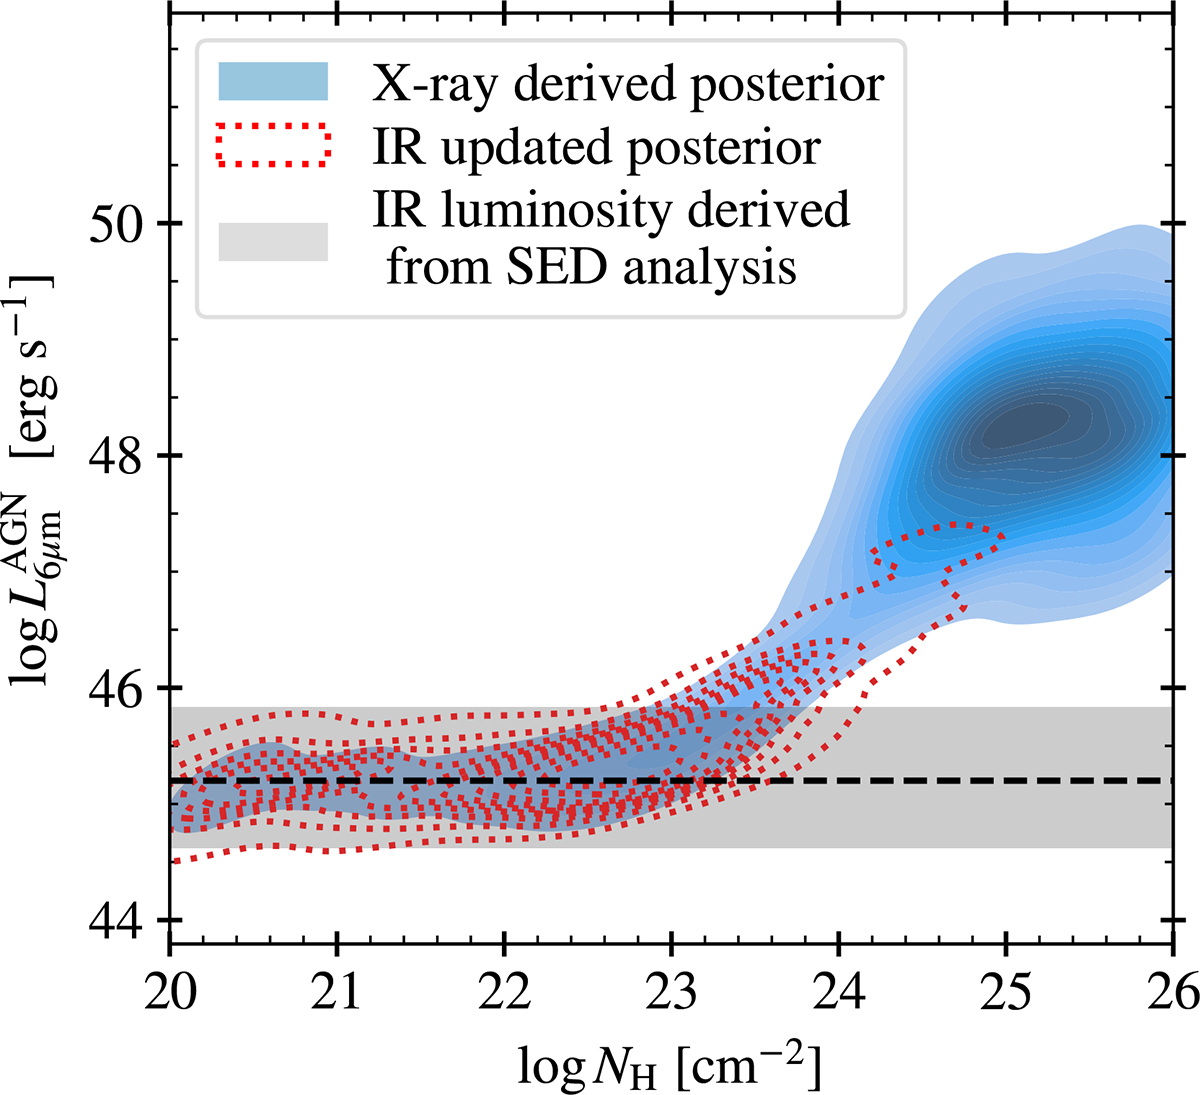
Joint posterior distribution in the log NH − log L6 μm plane (shaded blue region) for source lid_1278, one of our CTK candidates. The IR luminosity L6 μm is inferred from the X-ray luminosity posterior via the Stern (2015) relation. The dashed black line and the shaded grey region show the SED-inferred L6 μm value and its uncertainty, while the red dotted contours indicate the posterior distribution after incorporating the IR prior.
Current usage metrics show cumulative count of Article Views (full-text article views including HTML views, PDF and ePub downloads, according to the available data) and Abstracts Views on Vision4Press platform.
Data correspond to usage on the plateform after 2015. The current usage metrics is available 48-96 hours after online publication and is updated daily on week days.
Initial download of the metrics may take a while.