


Fig. 3.
Download original image
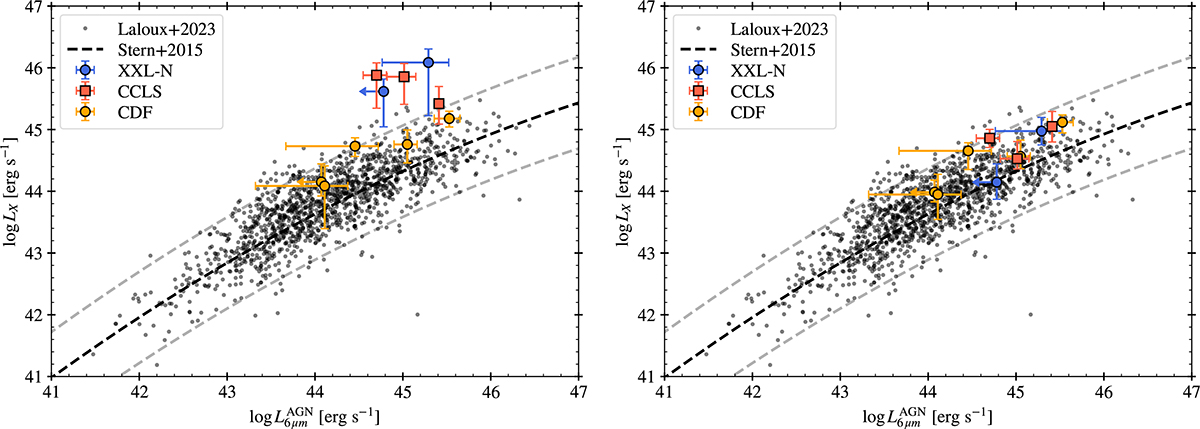
Intrinsic X-ray luminosity in the 2−10 keV band versus the monochromatic 6 μm luminosity of the AGN component. The results for our CTK sample are shown before (left panel) and after (right panel) applying the IR luminosity prior, as described in Sect. 3.2. Grey dots represent the X-ray–selected AGN sample from Laloux et al. (2023) in the CCLS field. Large circles indicate our final CTK candidates, colour-coded by their parent X-ray survey: CDF (yellow), CCLS (red), XXL-N (blue). The dashed black line marks the LX − L6 μm relation from Stern (2015), while the dashed grey lines denote the 2σ dispersion of the Laloux et al. (2023) sample with respect to that relation.
Current usage metrics show cumulative count of Article Views (full-text article views including HTML views, PDF and ePub downloads, according to the available data) and Abstracts Views on Vision4Press platform.
Data correspond to usage on the plateform after 2015. The current usage metrics is available 48-96 hours after online publication and is updated daily on week days.
Initial download of the metrics may take a while.