


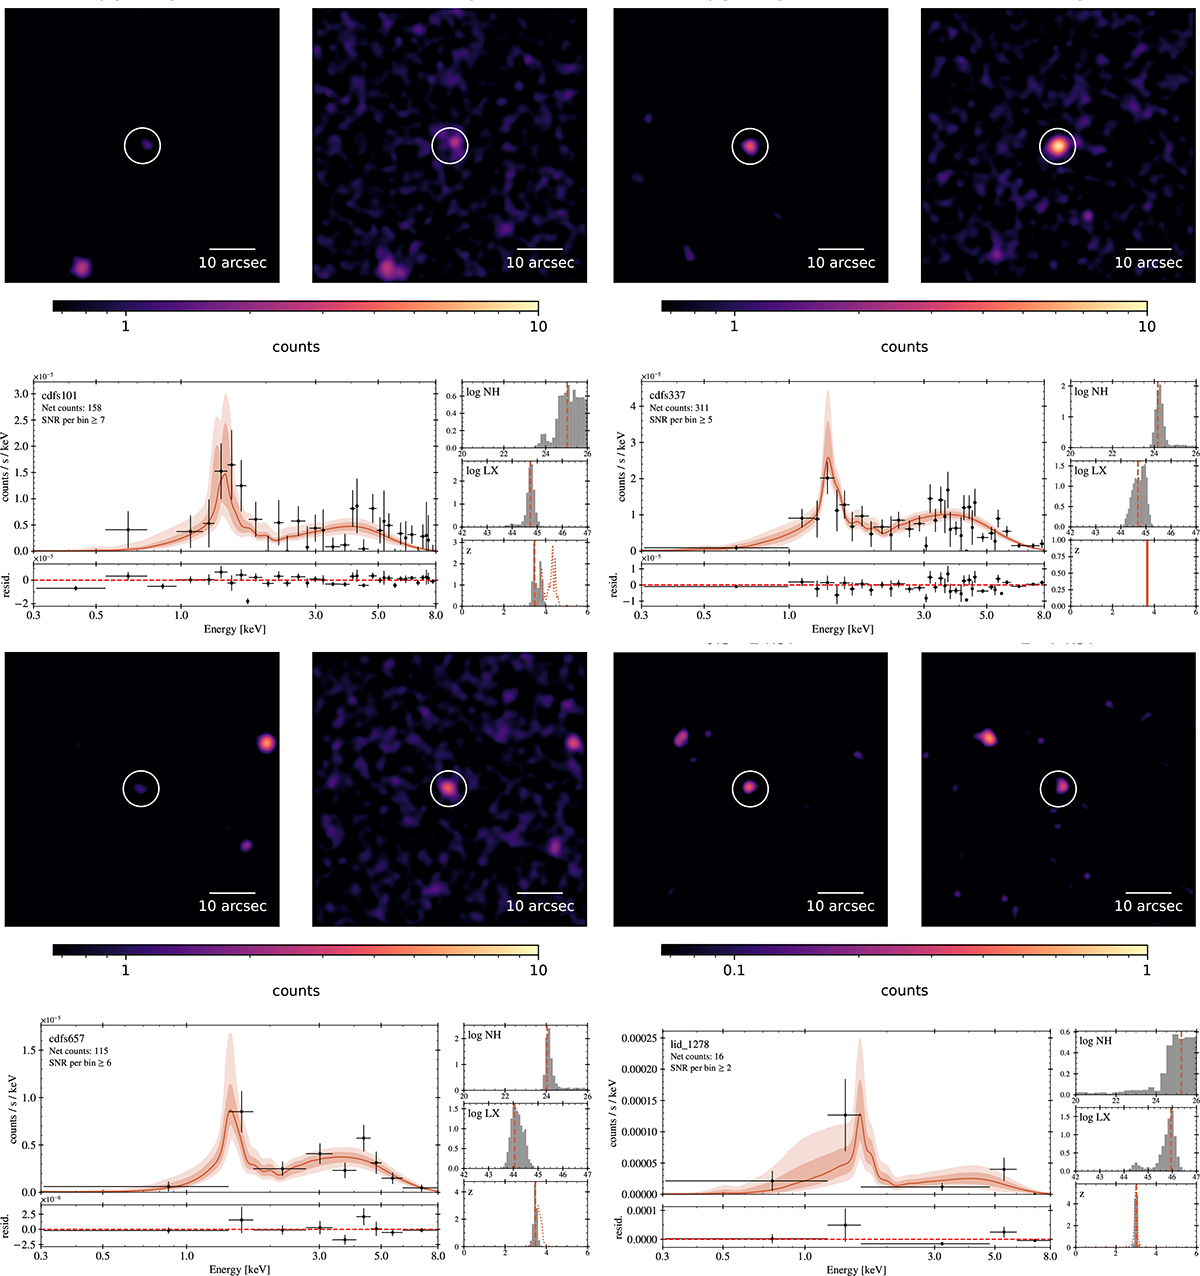
Fig. B.2.
Download original image
Chandra cutouts and spectra for the selected CTK candidates. Top: One arc-minutes Chandra-ACIS cutouts in the 0.5-2 keV (left) and 2-7 keV (right) bands. Bottom: Co-added, background-subtracted Chandra-ACIS spectrum. To improve visualization, the spectrum is binned. The red-shaded areas show the one- and two-sigma uncertainties for the best-fit source model (red, solid line). On the right column we plot the posterior distribution for log NH (top), log LX (middle), and redshift (bottom). The red, dashed lines show the mode of each distribution.
Current usage metrics show cumulative count of Article Views (full-text article views including HTML views, PDF and ePub downloads, according to the available data) and Abstracts Views on Vision4Press platform.
Data correspond to usage on the plateform after 2015. The current usage metrics is available 48-96 hours after online publication and is updated daily on week days.
Initial download of the metrics may take a while.