


Fig. A.3.
Download original image
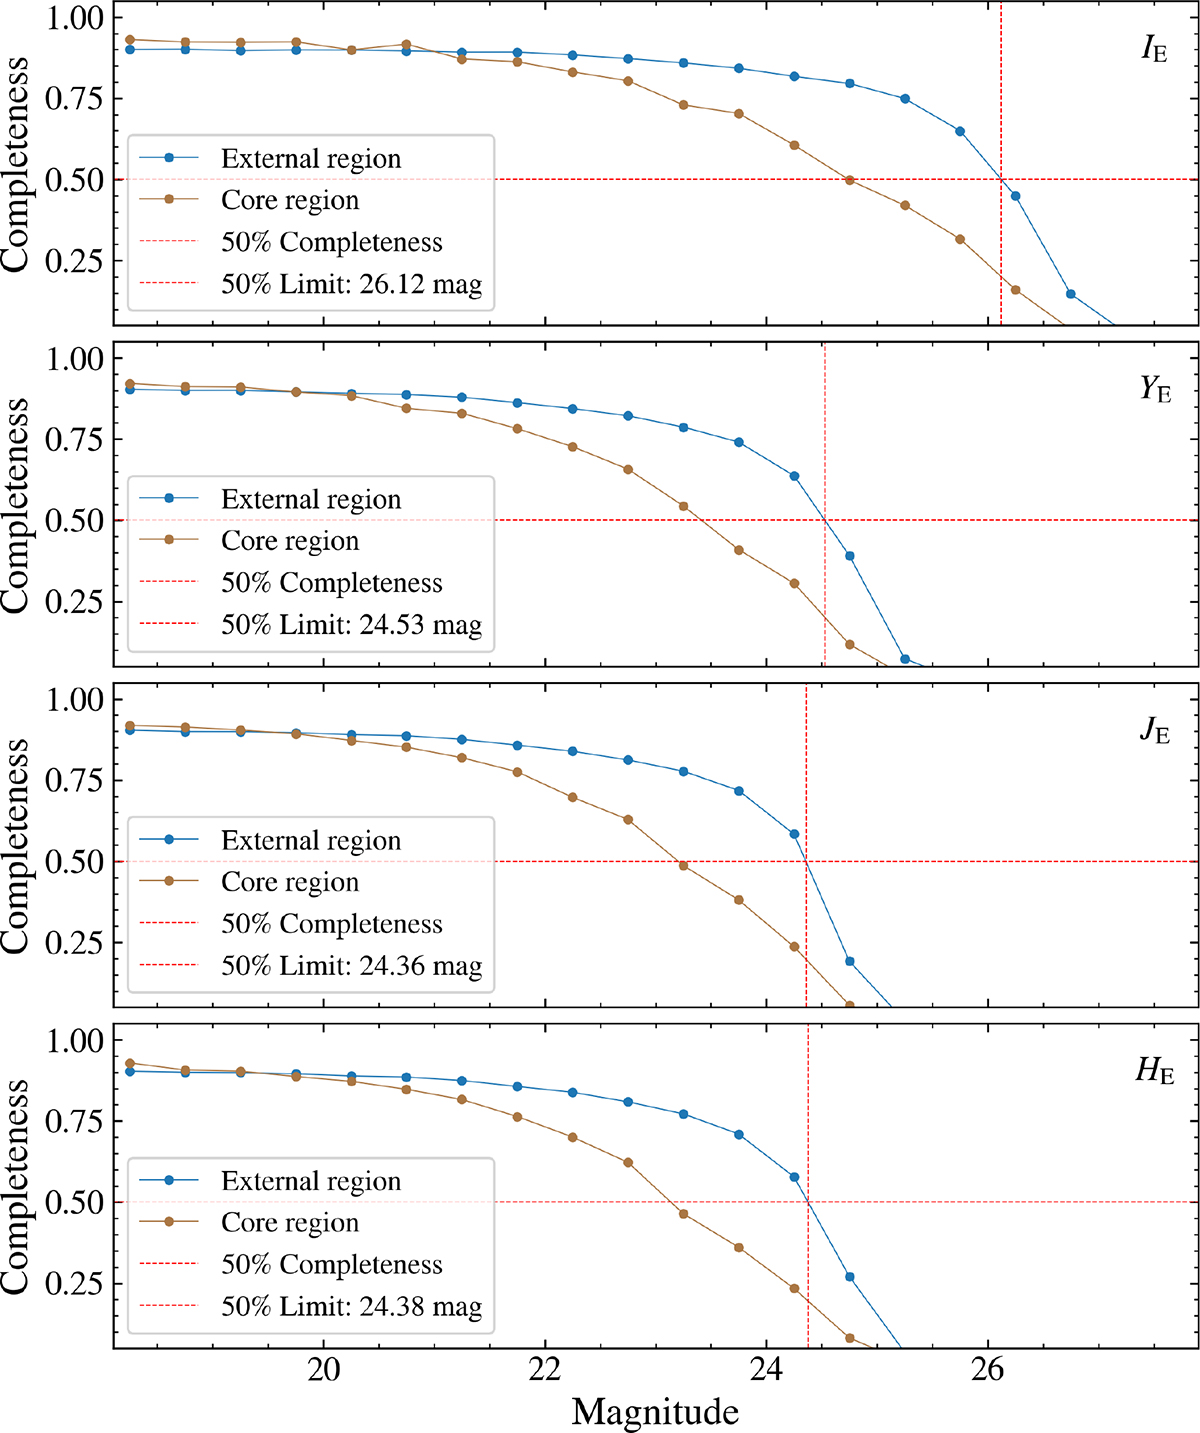
Completeness as a function of input magnitude for the VIS (top) and NISP (bottom) filters. Blue and red curves represent the recovery fraction in the external regions and the core region of the cluster, respectively. The horizontal dashed line indicates the 50% completeness level. In the outskirts of the cluster, the 50% threshold is reached at m ≈ 26 for VIS and m ≈ 24 for NISP, while crowding in the core shifts these limits to about 1 mag brighter. No quality cuts have been applied.
Current usage metrics show cumulative count of Article Views (full-text article views including HTML views, PDF and ePub downloads, according to the available data) and Abstracts Views on Vision4Press platform.
Data correspond to usage on the plateform after 2015. The current usage metrics is available 48-96 hours after online publication and is updated daily on week days.
Initial download of the metrics may take a while.