


Fig. A.1.
Download original image
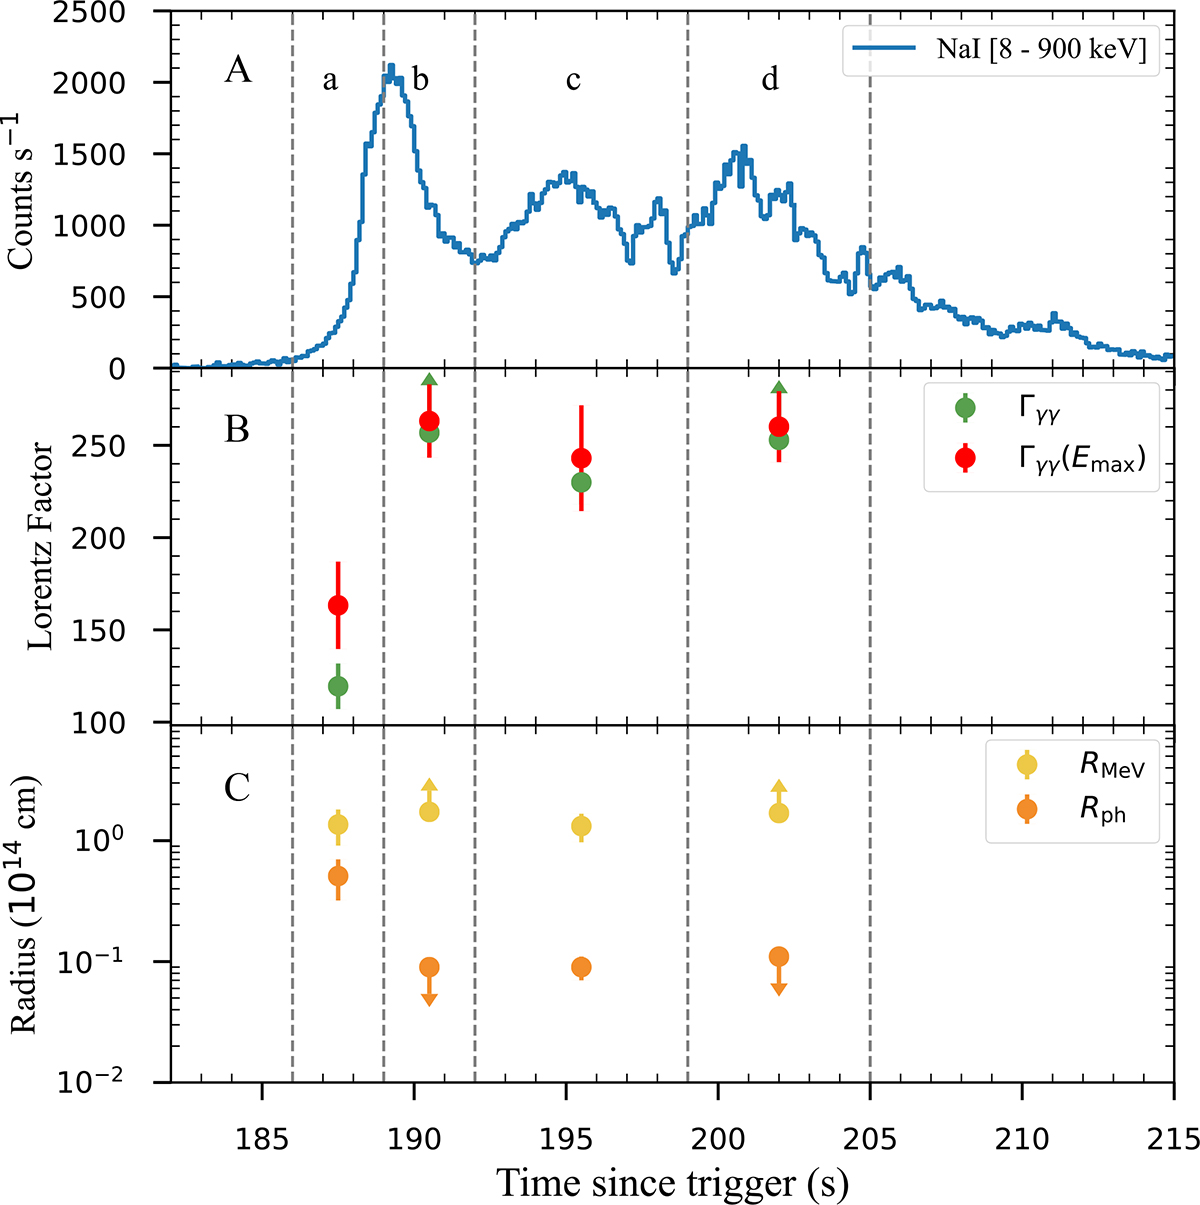
Time evolution of the Lorentz factor and characteristic radii, for the time-resolved spectra of GRB 160625B. Vertical gray dashed lines indicate the time intervals adopted for the spectral analysis. Panel A displays the count-rate light curve in the full NaI energy range, binned at 0.1 s. Panel B shows the Lorentz factors measured assuming that the high-energy cutoff at Ecutoff is either due to gamma-gamma opacity to pair production, or a natural break of the emission mechanisms (green and red symbols, respectively). Panel C presents the evolution of the radius at which the MeV photons are produced, and the photospheric radius (yellow and orange symbols, respectively). Arrows indicate upper or lower limits.
Current usage metrics show cumulative count of Article Views (full-text article views including HTML views, PDF and ePub downloads, according to the available data) and Abstracts Views on Vision4Press platform.
Data correspond to usage on the plateform after 2015. The current usage metrics is available 48-96 hours after online publication and is updated daily on week days.
Initial download of the metrics may take a while.