


Open Access
Fig. 3.
Download original image
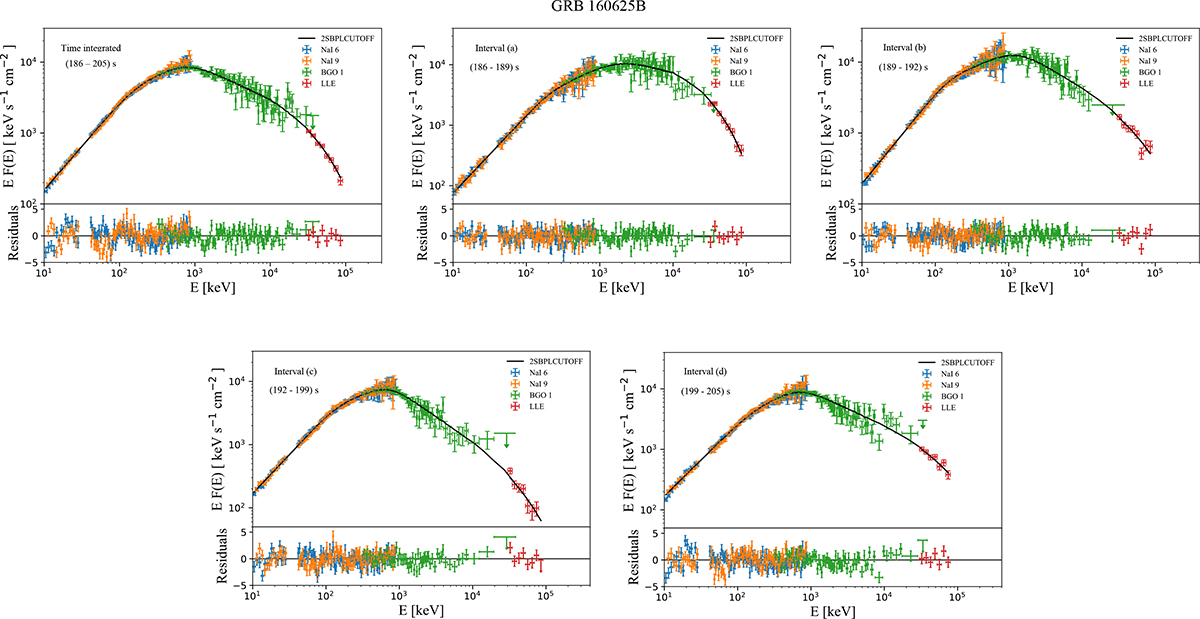
Time-integrated and time-resolved spectra of GRB 160625B in the 10 keV–100 MeV energy range fitted with the 2SBPLCUTOFF model (solid black line). The different colors correspond to the individual detectors, as indicated in the legend. In each panel, the lower strip displays the fit residuals. Arrows indicate lower limits.
Current usage metrics show cumulative count of Article Views (full-text article views including HTML views, PDF and ePub downloads, according to the available data) and Abstracts Views on Vision4Press platform.
Data correspond to usage on the plateform after 2015. The current usage metrics is available 48-96 hours after online publication and is updated daily on week days.
Initial download of the metrics may take a while.