


Fig. 2.
Download original image
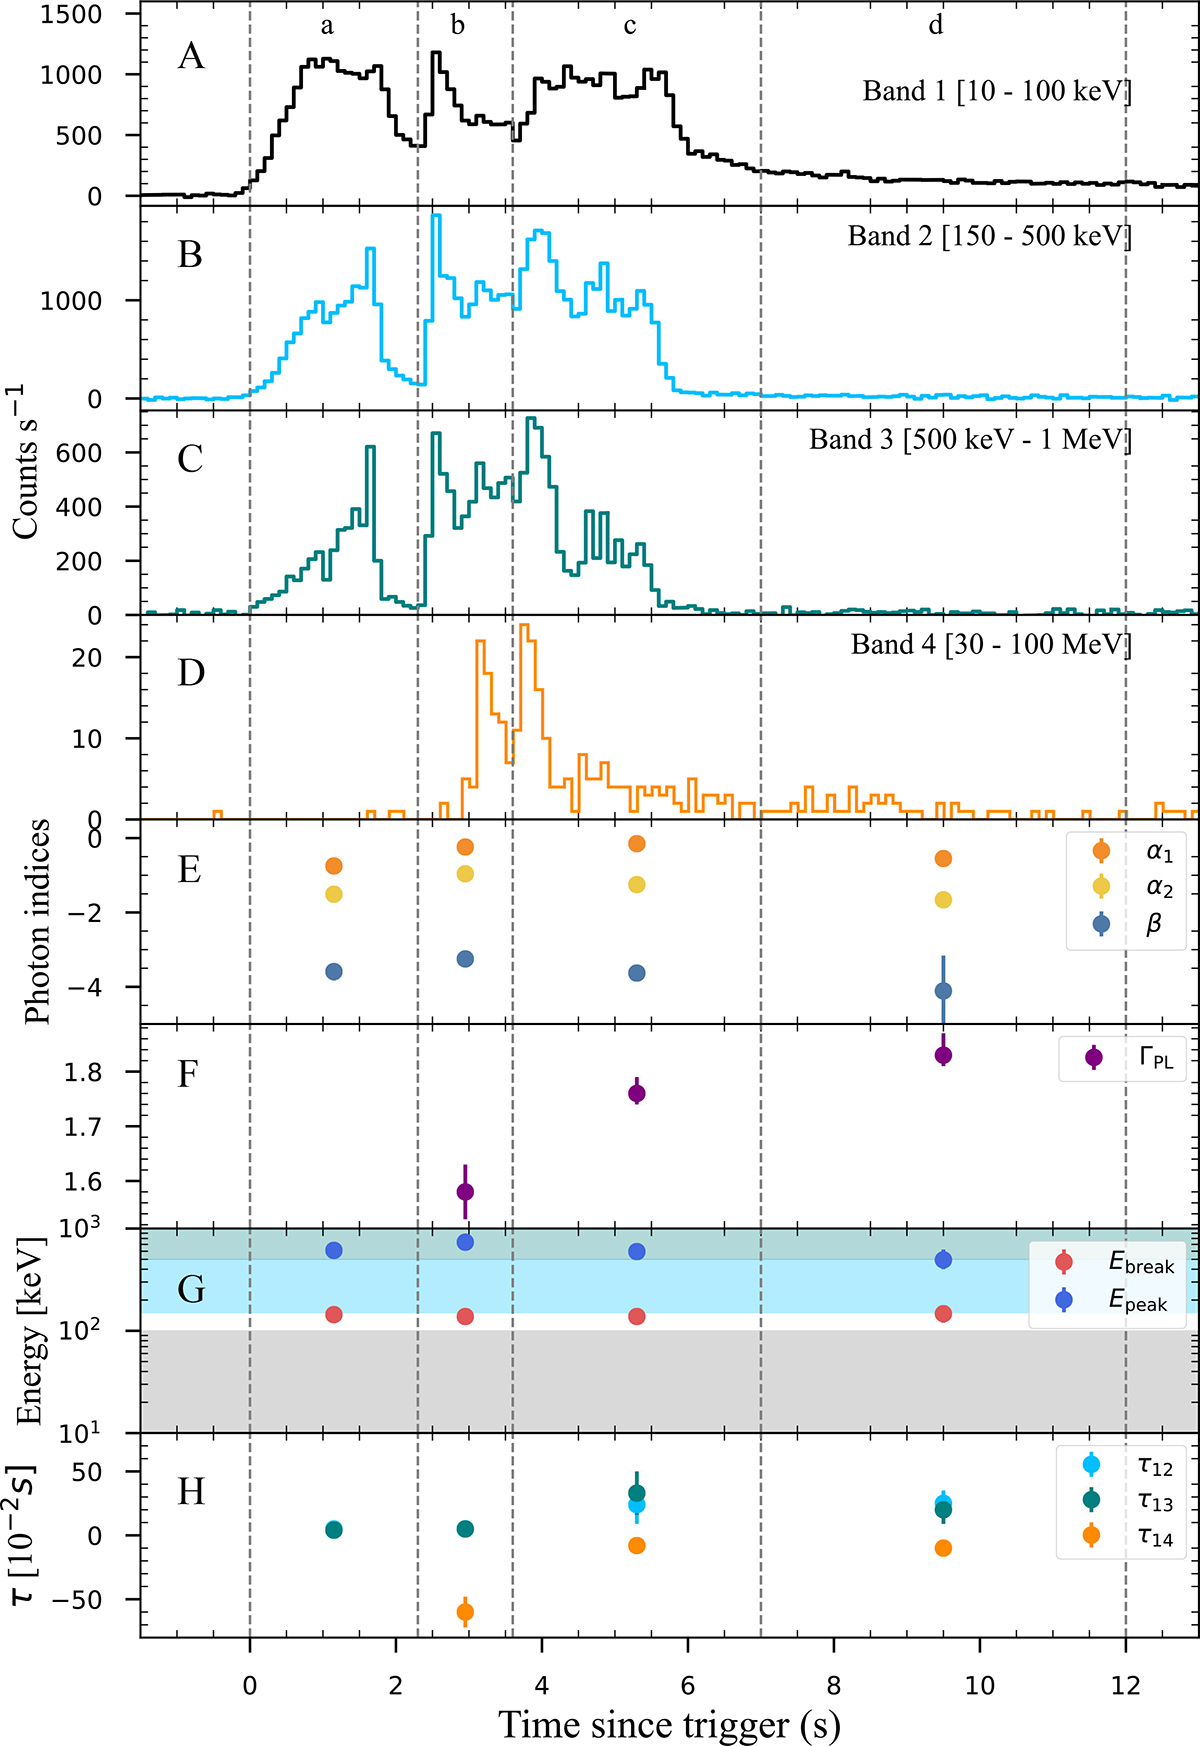
Time evolution of the spectral parameters and time lags obtained from the 2SBPL+PL model (Table 2) for the time-resolved spectra of GRB 190114C. The vertical dashed gray lines indicate the time intervals adopted for the spectral analysis (in time bin a, only GBM data were considered). Panels A–D display the count-rate light curves in Bands 1, 2, 3, and 4, binned at 0.1 s. Panel E shows the photon indices below the break energy, between the break and the peak energies, and above the peak energy (orange, yellow, and blue symbols, respectively). Panel F shows the evolution of the photon index of the additional power-law component (purple symbols). Panel G presents the temporal evolution of Epeak and Ebreak (red and blue symbols, respectively). The light gray, blue, and green shaded regions mark the energy ranges corresponding to Bands 1, 2, and 3. Panel H shows the time lags between Band 1 and Bands 2, 3, and 4 (blue, green, and orange symbols, respectively; Table 3).
Current usage metrics show cumulative count of Article Views (full-text article views including HTML views, PDF and ePub downloads, according to the available data) and Abstracts Views on Vision4Press platform.
Data correspond to usage on the plateform after 2015. The current usage metrics is available 48-96 hours after online publication and is updated daily on week days.
Initial download of the metrics may take a while.