


Fig. 14.
Download original image
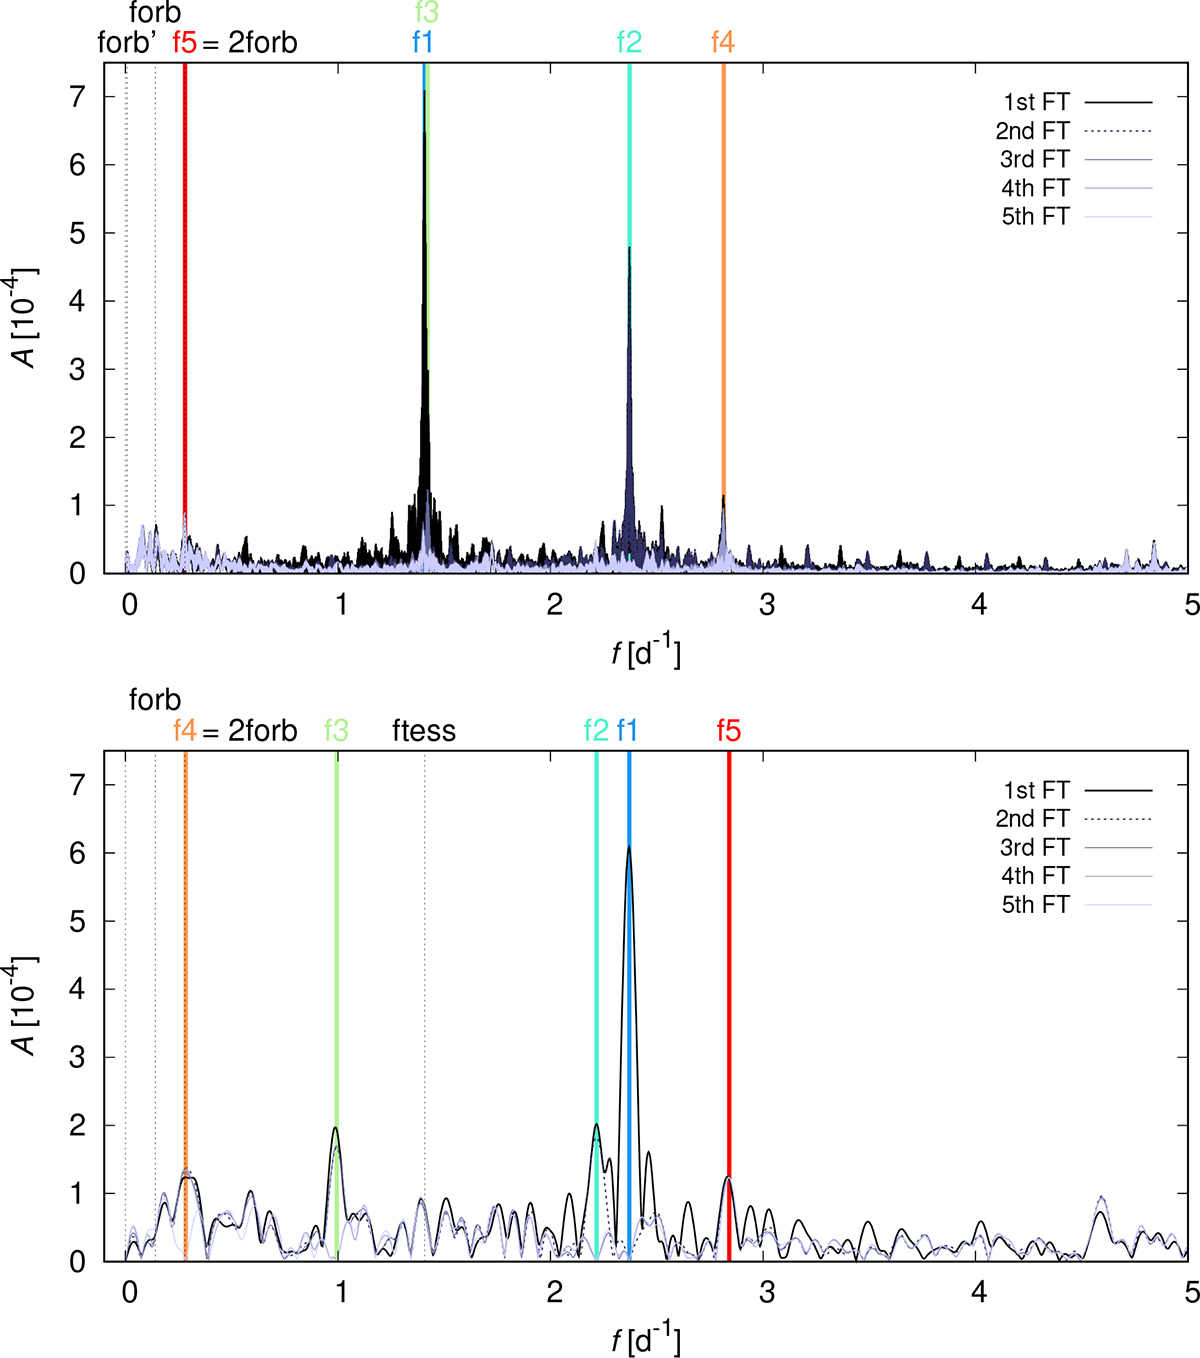
Periodogram of ξ Tau from the TESS (top) and MOST 2012 (bottom) light curves. We removed eclipses and computed five Fourier transforms (Lenz & Breger 2005), with fitting of frequencies, amplitudes and phases, and subtracting the respective model, ∑iAisin[2π(fit + ϕi)]. For TESS, the dominant frequencies were 1.407, 2.371, 1.421, 2.814, and 0.279 d−1. We note f4 = 2f1 and f5 = 2forb of the inner orbit. For MOST 2012, on the contrary, we found 2.369, 2.216, 0.993, 0.282, and 2.839 d−1. The non-existent 1.407 d−1 frequency is labeled “ftess”.
Current usage metrics show cumulative count of Article Views (full-text article views including HTML views, PDF and ePub downloads, according to the available data) and Abstracts Views on Vision4Press platform.
Data correspond to usage on the plateform after 2015. The current usage metrics is available 48-96 hours after online publication and is updated daily on week days.
Initial download of the metrics may take a while.