


Fig. 1.
Download original image
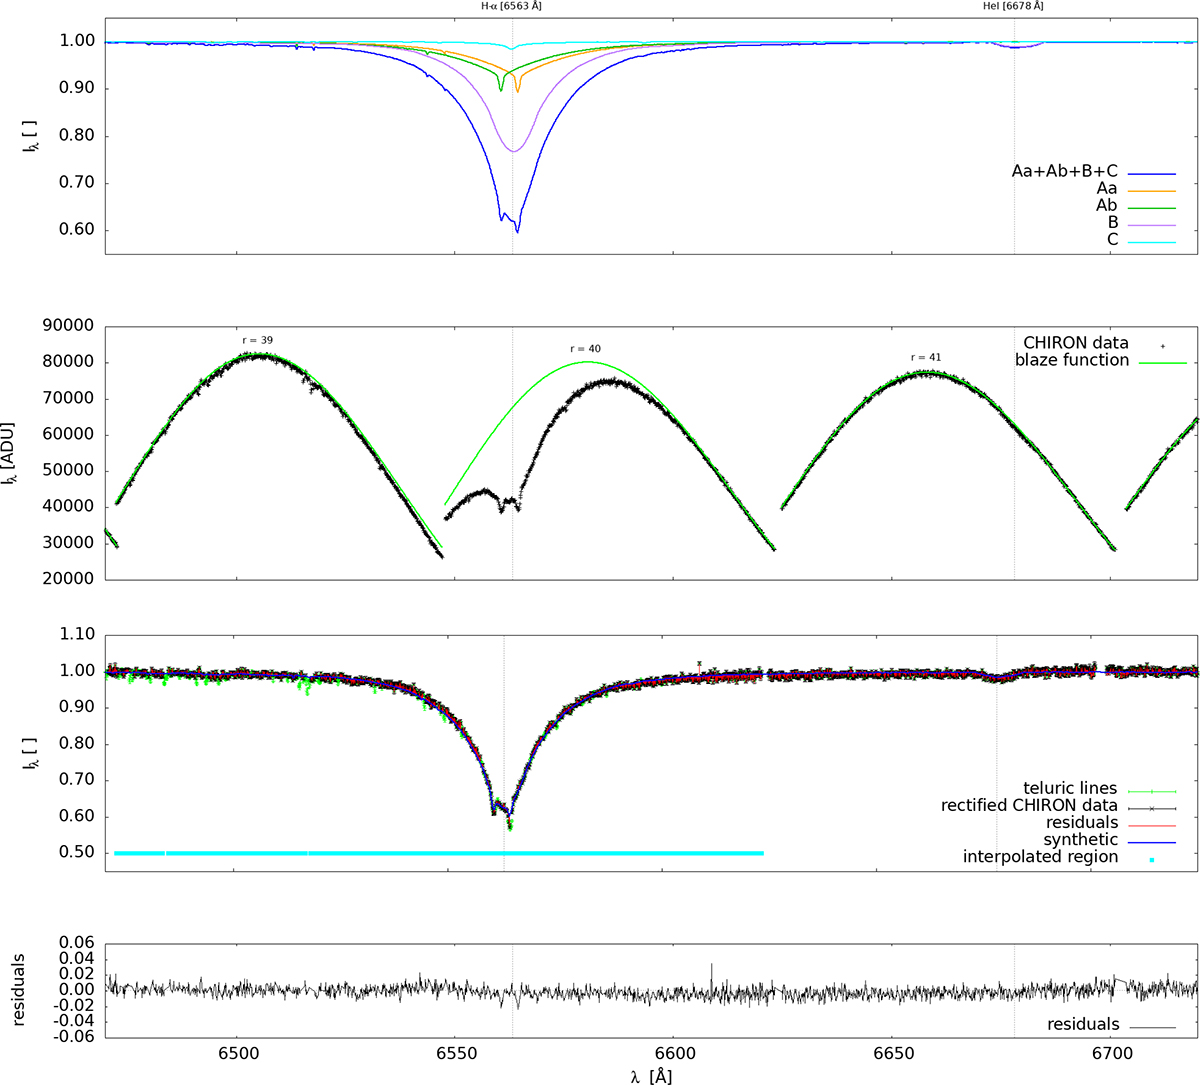
Rectification of a CTIO/CHIRON echelle spectrum (ktc00027) in the region of the Hα line (6563 Å), using the resimplex3 method. Top: Synthetic spectra were computed from our model in Table 1, ‘all-data’ column. Four component spectra (Aa, Ab, B, C) and the resulting spectrum are plotted. Second row: Observed spectrum from CHIRON (black), orders r = 39 to 41, and the corresponding blaze function (green). Third row: Rectified spectrum (black), its comparison to the synthetic spectrum (blue), and corresponding residuals (red). The rectification was done with respect to the continuum level, with interpolation of the blaze parameters over wide lines (cyan) and problematic orders, also avoiding locations of the telluric lines (green). Bottom: Residuals plotted separately.
Current usage metrics show cumulative count of Article Views (full-text article views including HTML views, PDF and ePub downloads, according to the available data) and Abstracts Views on Vision4Press platform.
Data correspond to usage on the plateform after 2015. The current usage metrics is available 48-96 hours after online publication and is updated daily on week days.
Initial download of the metrics may take a while.