


Fig. B.2
Download original image
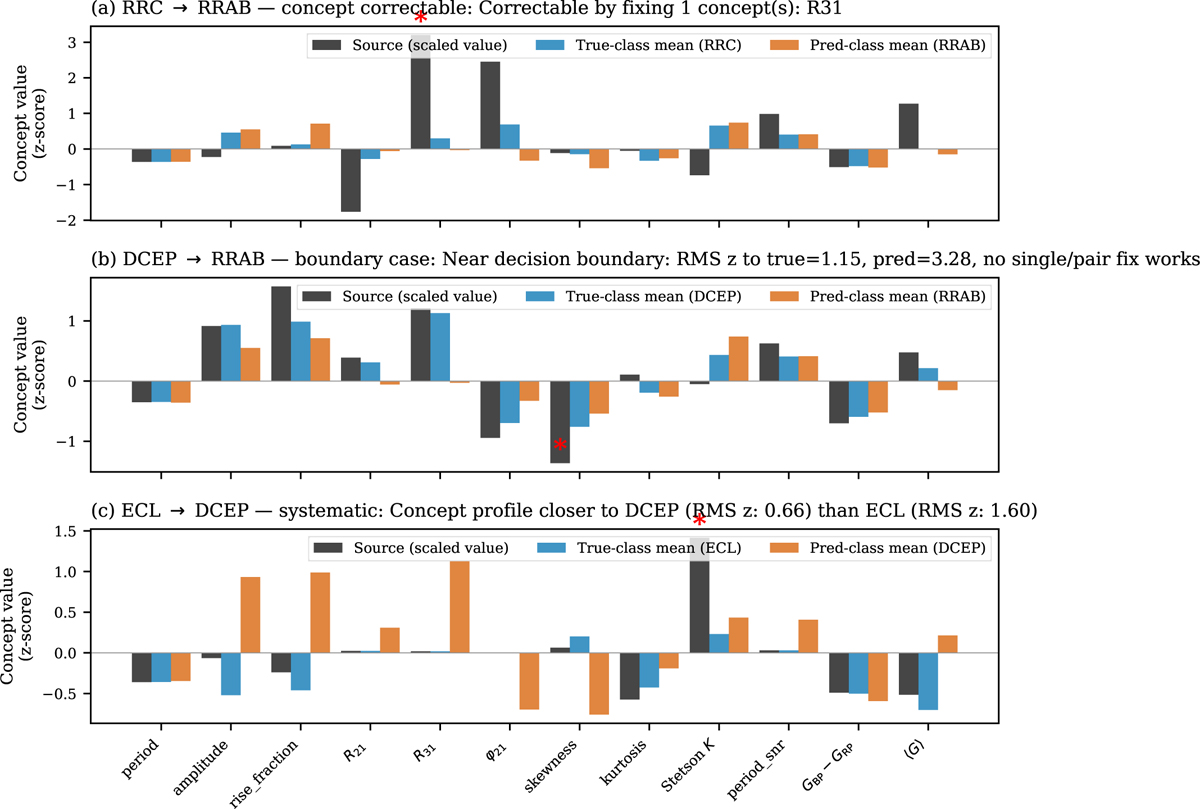
Three representative misclassified sources from the held-out test set, one per category from Sect. 5.2: (a) a concept-correctable RRC→RRAB error; (b) a boundary case; (c) a systematic case. Bars show the source’s 12 scaled concept values against the mean concept profile of the true class (blue) and the predicted class (orange). Red asterisks flag concepts that deviate by more than 2σ from the true-class mean—these are the actionable intervention targets for an astronomer inspecting the prediction.
Current usage metrics show cumulative count of Article Views (full-text article views including HTML views, PDF and ePub downloads, according to the available data) and Abstracts Views on Vision4Press platform.
Data correspond to usage on the plateform after 2015. The current usage metrics is available 48-96 hours after online publication and is updated daily on week days.
Initial download of the metrics may take a while.