


Fig. 9
Download original image
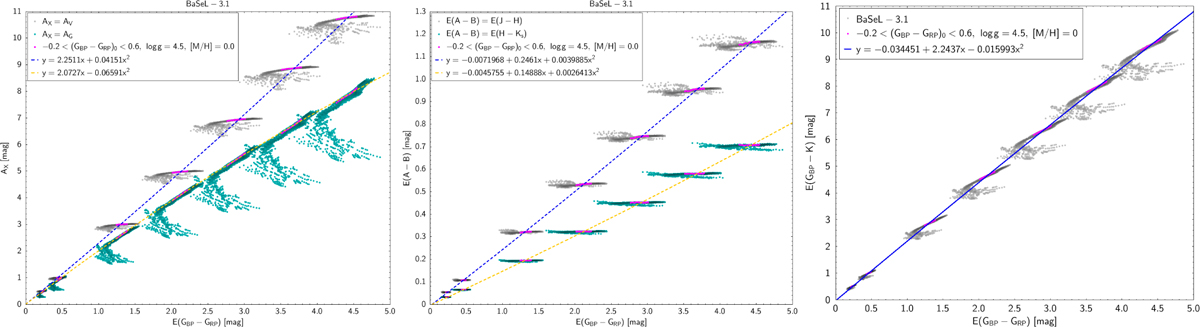
Simulations of absorption and colour excesses using the Basel-3.1 synthetic spectral library (Westera et al. 2002). Left: relationship between absorption in the V (grey) and G (cyan) passbands. For the polynomial fitting in Eqs. (1) (blue line) and (2) (orange line), we used only the magenta points (sources with reliable E(GBP – GRP) estimations). Centre and right: Near-infrared 2MASS colour excesses as functions of E(GBP – GRP) Centre: 2MASS E(J – H) (grey) and E(H – Ks) (cyan) and lines show the polynomial fits in Eqs. (3) and (4). Right: excess in the combined optical-infrared colour E(GBP – KS). The blue line shows the polynomial fit given in Eq. (5).
Current usage metrics show cumulative count of Article Views (full-text article views including HTML views, PDF and ePub downloads, according to the available data) and Abstracts Views on Vision4Press platform.
Data correspond to usage on the plateform after 2015. The current usage metrics is available 48-96 hours after online publication and is updated daily on week days.
Initial download of the metrics may take a while.