


Fig. 8
Download original image
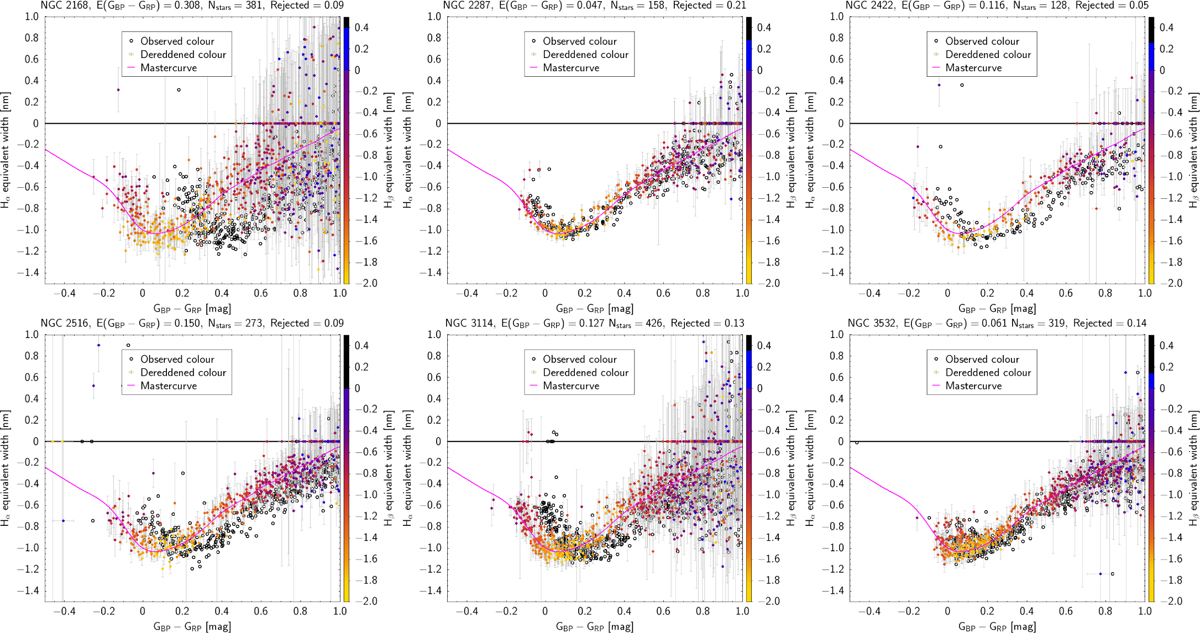
Relation between Ha EW and GBP – GRP for the same OCs as in Fig. 2. Open black symbols show stars plotted with their observed colours; filled symbols show the same stars after shifting by the colour excess obtained in Sect. 5. Symbol colour encodes the Hß EW. The title of each panel includes the values for the colour excess, the number of stars and the fraction (normalised to one) of outliers in the cluster.
Current usage metrics show cumulative count of Article Views (full-text article views including HTML views, PDF and ePub downloads, according to the available data) and Abstracts Views on Vision4Press platform.
Data correspond to usage on the plateform after 2015. The current usage metrics is available 48-96 hours after online publication and is updated daily on week days.
Initial download of the metrics may take a while.