


Fig. 5
Download original image
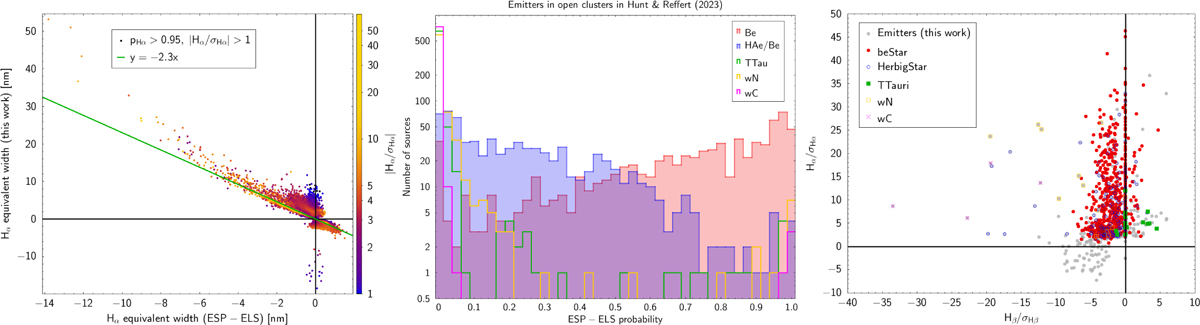
Comparison between Hα EWs measured in this work and the Gaia DR3 ESP-ELS results (Creevey et al. 2023). Left: direct EW comparison for OC members with |(S/N)Hα| > 1 and pHα > 0.95, colour-coded by |(S/N)Hα|. The difference in sign convention (emission positive here and negative in Creevey et al. 2023) produces the anti-correlation. The green line indicates a slope of −2.3. Middle: probability distributions for different emission types (Be, Herbig Ae/Be, T Tauri, carbon and nitrogen Wolf–Rayet) from Creevey et al. (2023). Right: (S/N)Hα versus (S/N)Hβ coloured by ESP-ELS types; grey points without colour coding represent new emission candidates from this work.
Current usage metrics show cumulative count of Article Views (full-text article views including HTML views, PDF and ePub downloads, according to the available data) and Abstracts Views on Vision4Press platform.
Data correspond to usage on the plateform after 2015. The current usage metrics is available 48-96 hours after online publication and is updated daily on week days.
Initial download of the metrics may take a while.