


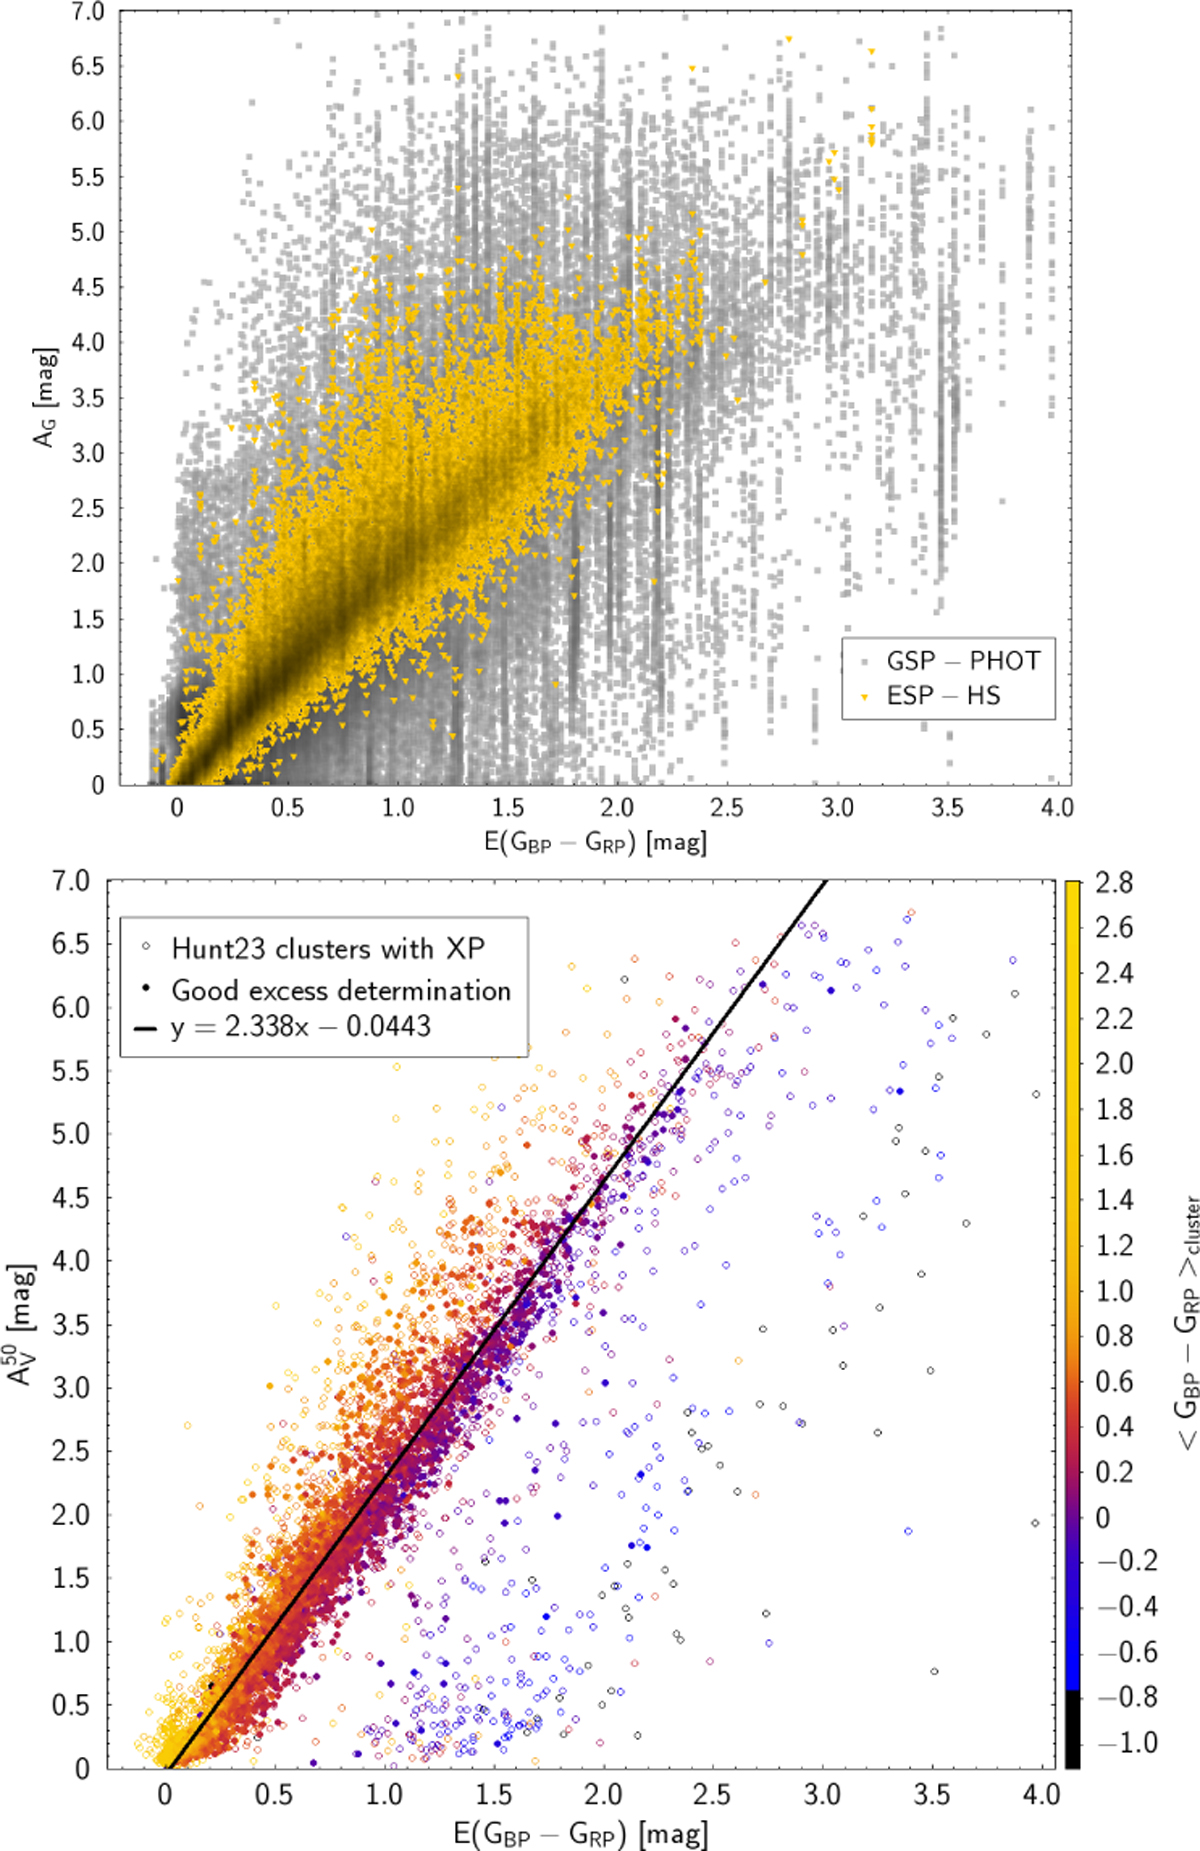
Fig. 12
Download original image
Interstellar absorption from different works plotted against the E(GBP – GRP) colour excess derived in this work for OCs (see Sect. 5). Top: correlation between our colour excesses compared with the interstellar absorption derived from Gaia GSP-Phot Andrae et al. (2023) (grey squares) and ESP-HS (Creevey et al. 2023) (orange triangles). Bottom:  values in the ordinate axis from Hunt & Reffert (2023), with solid symbol marking sources with good excess determination. The colour index indicates the median intrinsic colour of each OC. The black line shows a linear fit. Both panels use the same axis scales.
Current usage metrics show cumulative count of Article Views (full-text article views including HTML views, PDF and ePub downloads, according to the available data) and Abstracts Views on Vision4Press platform.
Data correspond to usage on the plateform after 2015. The current usage metrics is available 48-96 hours after online publication and is updated daily on week days.
Initial download of the metrics may take a while.