


Fig. 1
Download original image
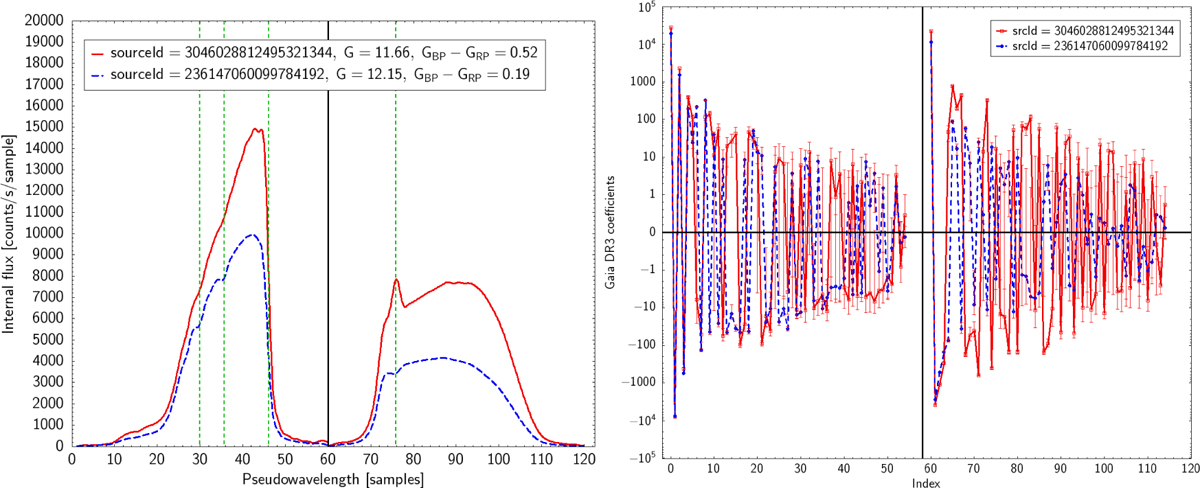
Example Gaia DR3 internal XP spectra (left) and their coefficients (right) for two sources: one with Hα in emission (solid red line) and one with Balmer absorption lines (dashed blue line). The RP pseudo-wavelengths (left panel) and index coefficients (right panel) are shifted by +60 so that BP and RP appear side by side. The solid vertical black line separates the BP (left) and RP (right) spectra. Left panel: pseudo-wavelengths represented in the abscissa increase from shorter (left) to longer (right) wavelengths; dashed vertical green lines mark the positions of Hα in RP and of Hα, Hß and Hγ in BP (from right to left) using the nominal Gaia dispersion relation. Right: ordinate uses a symmetric logarithmic scale to better display the small high-order coefficients relative to the large low-order ones.
Current usage metrics show cumulative count of Article Views (full-text article views including HTML views, PDF and ePub downloads, according to the available data) and Abstracts Views on Vision4Press platform.
Data correspond to usage on the plateform after 2015. The current usage metrics is available 48-96 hours after online publication and is updated daily on week days.
Initial download of the metrics may take a while.