


Fig. 7.
Download original image
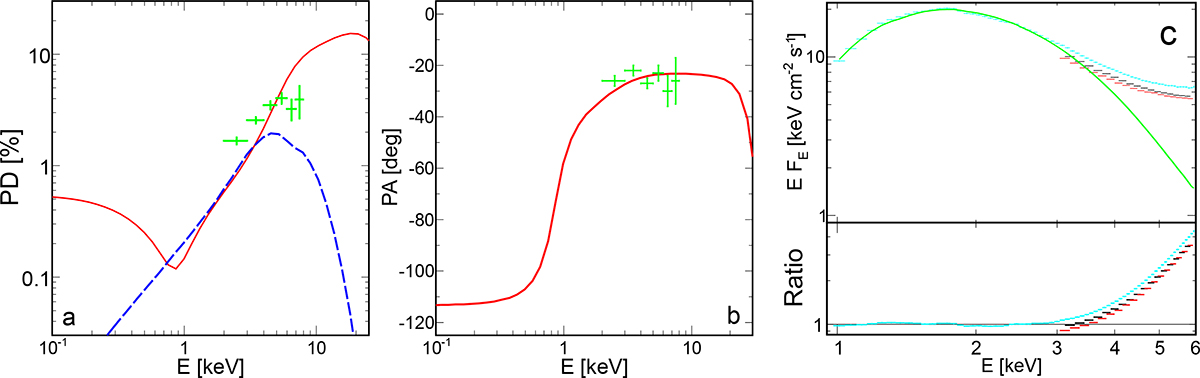
Comparison of model 4 with the spectropolarimetric data on Cyg X-1. Panels (a) and (b): Comparison of the polarization properties of model 4 (solid red curves), following the assumptions of the “no-corona” model in Steiner et al. (2024) (i.e., including only the thermal disk), with the soft-state IXPE data on Cyg X-1. Panel (c): Attempted fit of this model to the NICER and NuSTAR spectral data. The observed data (cyan, red, and black; as in Fig. 3) are shown in the top panel, together with the best-fit model (green), while the data-to-model ratio is shown in the bottom panel. The dashed blue curve in panel (a) shows the contribution to the PD of the returning disk component for the parameters used in Steiner et al. (2024); see Sect. 4.3.
Current usage metrics show cumulative count of Article Views (full-text article views including HTML views, PDF and ePub downloads, according to the available data) and Abstracts Views on Vision4Press platform.
Data correspond to usage on the plateform after 2015. The current usage metrics is available 48-96 hours after online publication and is updated daily on week days.
Initial download of the metrics may take a while.