


Fig. A.1.
Download original image
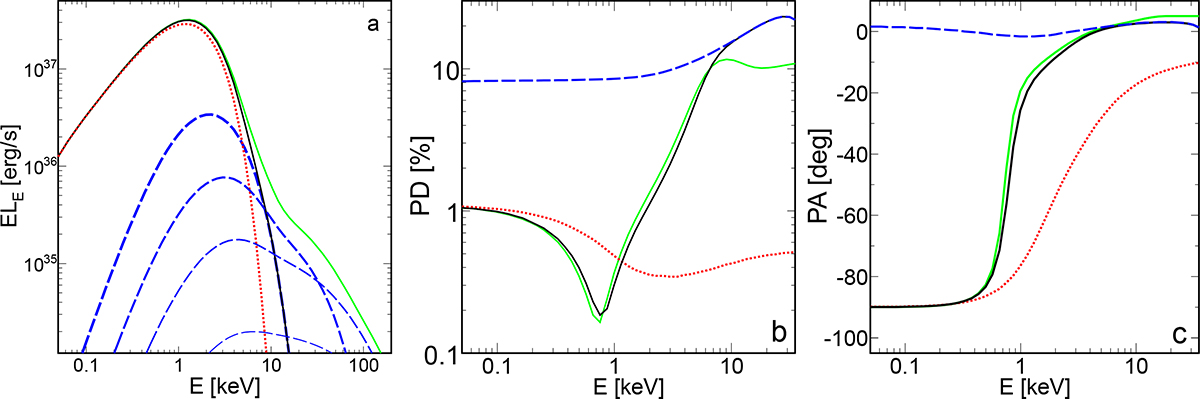
Observed spectrum, PD, and PA predicted by retBB for a = 0.998, M = 21.2 M⊙, Ṁ = 2.5 × 10¹⁷ g s−1, i = 45° and fcol = 1.5. (a) The red dotted curve shows the spectrum of the direct disk emission. The blue dashed curves from top to bottom show spectra of the first to fourth orders of elastic reflection of the returning radiation. The solid black and green curves show the total spectrum, including single- and multiple-scattering (up to fourth order) of the returning radiation, respectively. (b) and (c) PD and PA, including a single (black solid) or multiple (up to the fourth order; green solid) reflection of returning radiation; blue dashed and red dotted curves show contributions of the first order reflection and direct disk radiation, respectively.
Current usage metrics show cumulative count of Article Views (full-text article views including HTML views, PDF and ePub downloads, according to the available data) and Abstracts Views on Vision4Press platform.
Data correspond to usage on the plateform after 2015. The current usage metrics is available 48-96 hours after online publication and is updated daily on week days.
Initial download of the metrics may take a while.