


Fig. 3.
Download original image
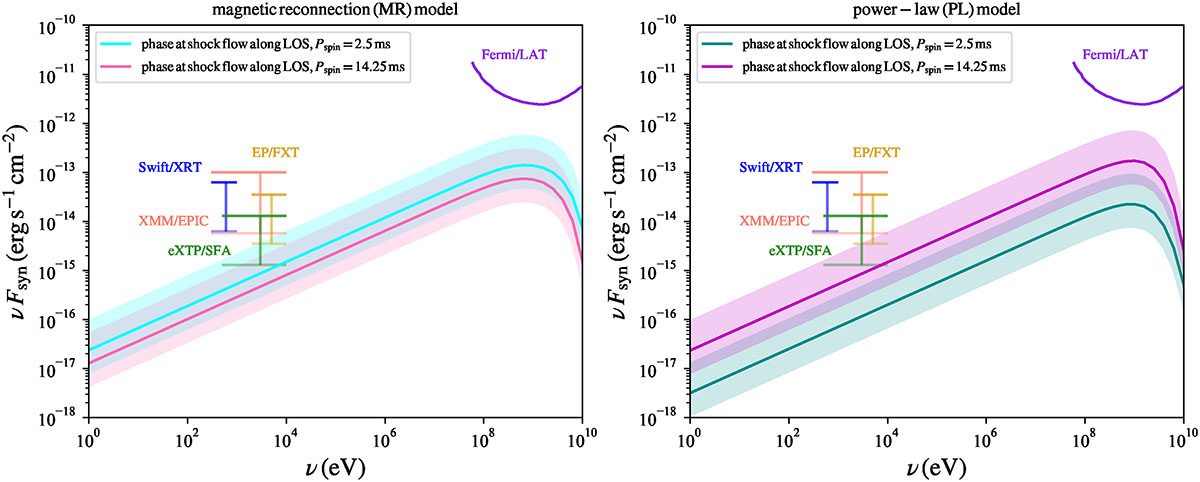
SED of PSR J1932+2121 at the phase of shock flow along the LOS, shown for the MR (left) and PL magnetization decay (right) models. The shaded region indicates the uncertainty associated with the source distance, taken to be 1.5 ∼5.1 kpc by Misra et al. (2025), while the solid line running through the middle of each shaded region corresponds to the calculation with the adopted average distance of 3.3 kpc. The sensitivity limits for Swift, EP/FXT, XMM/EPIC, and eXTP/SFA are adopted from Burrows et al. (2005), Yuan et al. (2022), Traulsen et al. (2019), and Zhang et al. (2019), respectively, assuming representative exposure times of 1–100 ks. The upper limits of Fermi/LAT are from Werner et al. (2013) and are shown as an additional constraint on the high-energy tail of the spectrum.
Current usage metrics show cumulative count of Article Views (full-text article views including HTML views, PDF and ePub downloads, according to the available data) and Abstracts Views on Vision4Press platform.
Data correspond to usage on the plateform after 2015. The current usage metrics is available 48-96 hours after online publication and is updated daily on week days.
Initial download of the metrics may take a while.