


Fig. 5
Download original image
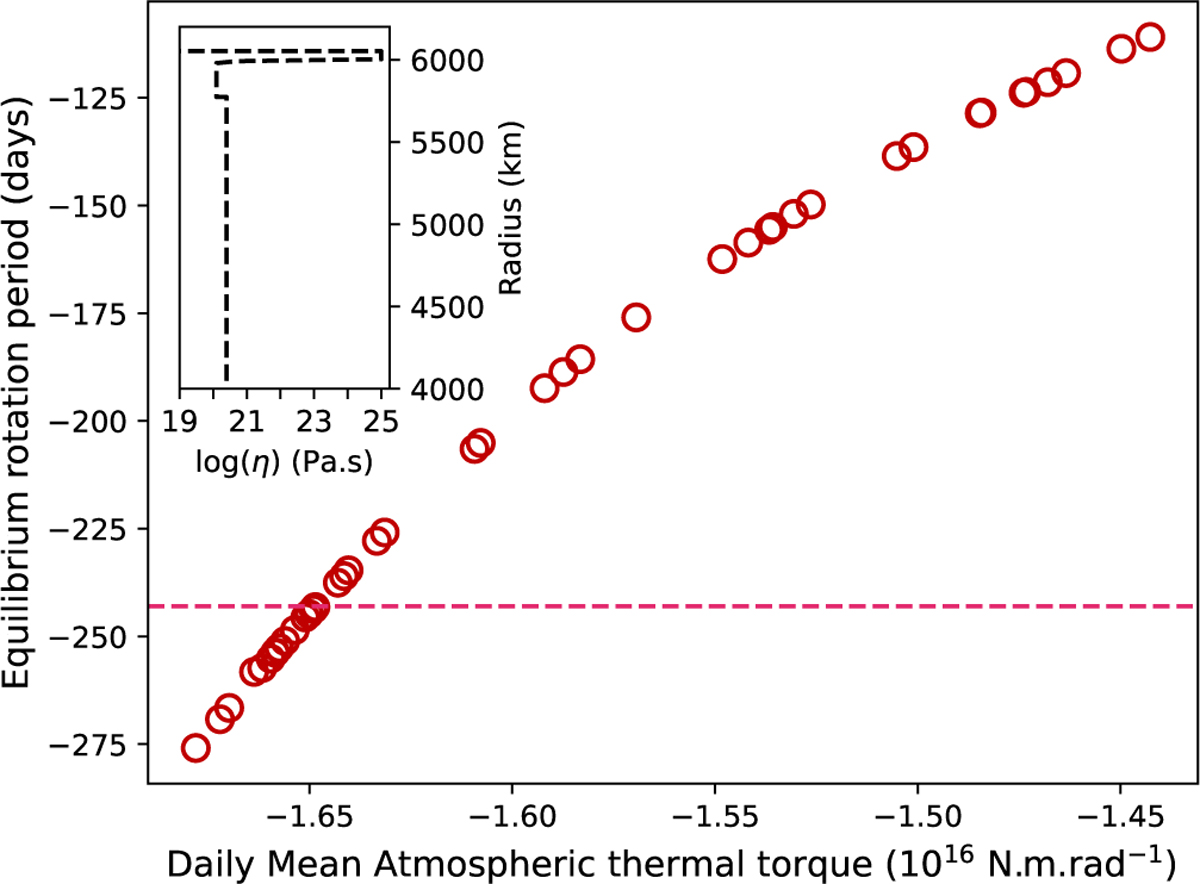
Equilibrium rotation period as function of the atmospheric thermal torque computed for all the investigated topographic configurations. The current rotation period is indicated by the dotted pink line. The three-layer viscosity profile (composed by a crust, an upper mantle, and a 10 times more viscous lower mantle above a liquid core) used to compute the equilibrium rotation period is also represented in the upper right corner.
Current usage metrics show cumulative count of Article Views (full-text article views including HTML views, PDF and ePub downloads, according to the available data) and Abstracts Views on Vision4Press platform.
Data correspond to usage on the plateform after 2015. The current usage metrics is available 48-96 hours after online publication and is updated daily on week days.
Initial download of the metrics may take a while.