


Fig. 3
Download original image
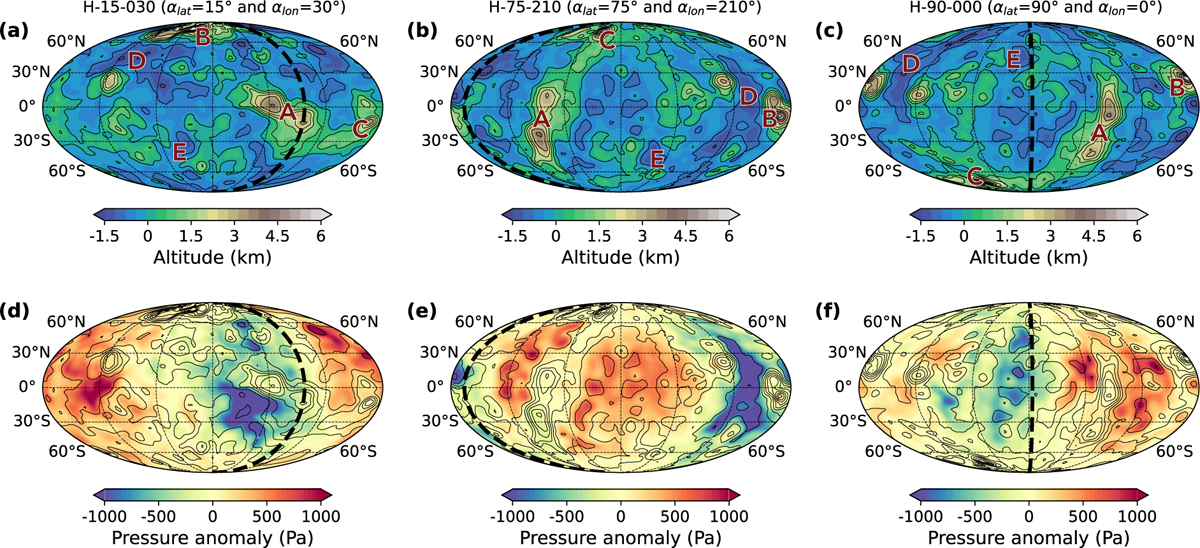
Topographic (panels a–c) and pressure anomaly (panels d–f) maps for three different topographic configurations. (a) and (d): αlat = 15° and αlon = 30° (H-15-030). (b) and (e): αlat = 75° and αlon = 210° (H-75-210).(c) and (f): αlat = 90° and αlon = 0° (H-90-000). The black lines display the topographic contours in all panels, while the thick dotted black line indicates the longitude of the subsolar point. Letter A–E indicate the locations of the principal provinces of Venus, as defined in the caption of Fig. 1.
Current usage metrics show cumulative count of Article Views (full-text article views including HTML views, PDF and ePub downloads, according to the available data) and Abstracts Views on Vision4Press platform.
Data correspond to usage on the plateform after 2015. The current usage metrics is available 48-96 hours after online publication and is updated daily on week days.
Initial download of the metrics may take a while.