


Fig. 13
Download original image
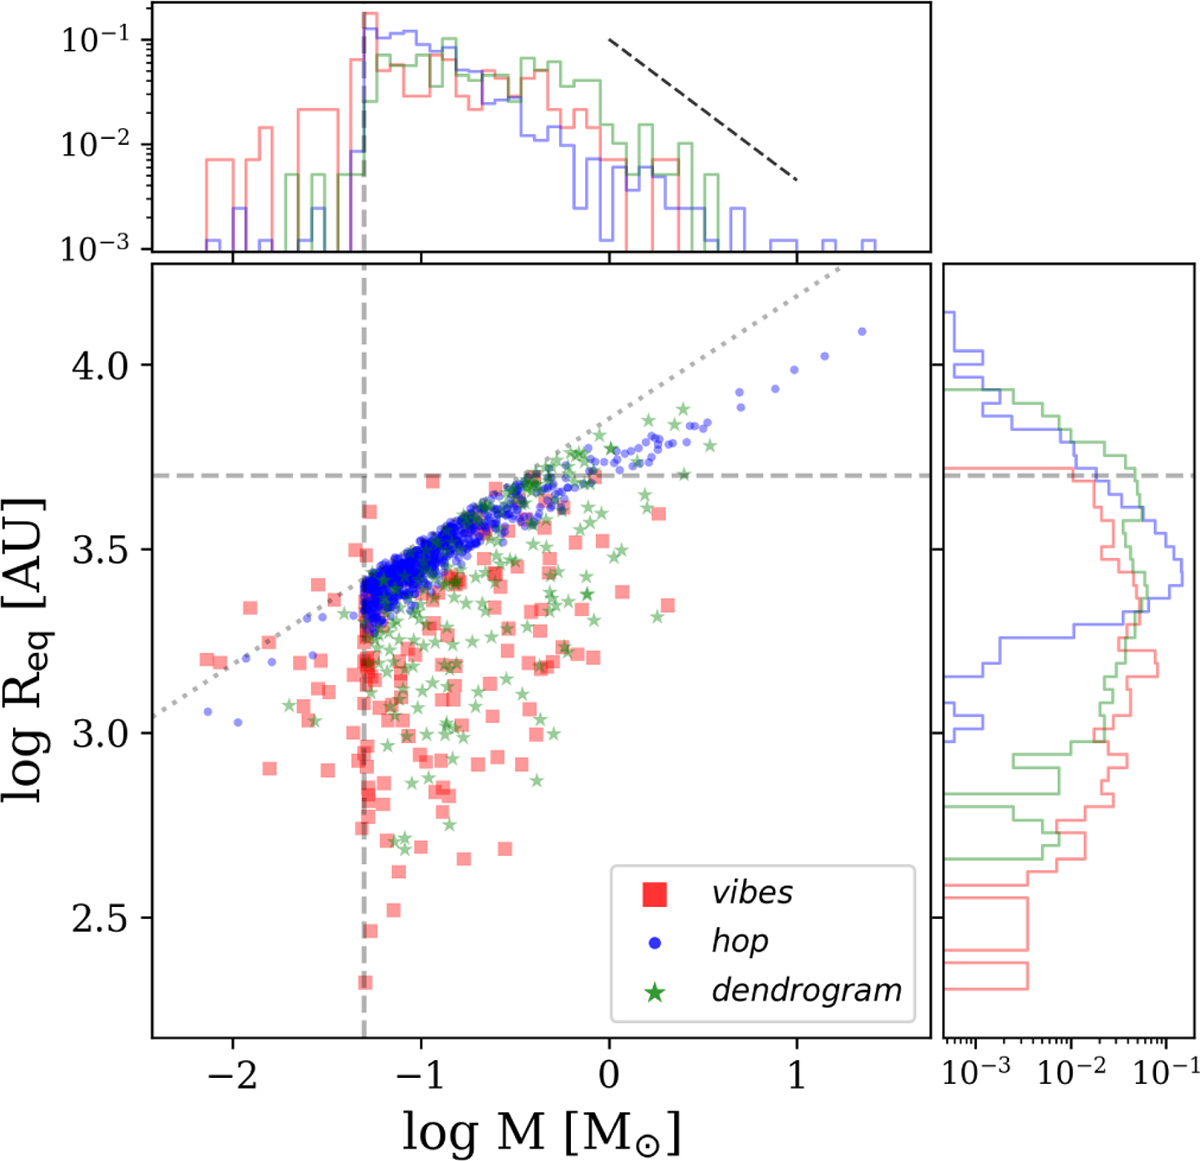
Equivalent radius with respect to the mass of the structures. The red squares, blue dots, and green stars correspond respectively to vibes, hop, and dendrogram objects. The dashed vertical gray line gives to the theoretical lower mass limit of 0.05 M⊙ (corresponding to 50 cells). The colors of the side histograms lines correspond to the scatter plot colors. The dashed horizontal gray line corresponds to the 5000 au maximum size for vibes objects. The dashed black line on the top histogram corresponds to Salpeter slope α = −1.35. The dotted slope gives  with
with  .
.
Current usage metrics show cumulative count of Article Views (full-text article views including HTML views, PDF and ePub downloads, according to the available data) and Abstracts Views on Vision4Press platform.
Data correspond to usage on the plateform after 2015. The current usage metrics is available 48-96 hours after online publication and is updated daily on week days.
Initial download of the metrics may take a while.