


Fig. 11
Download original image
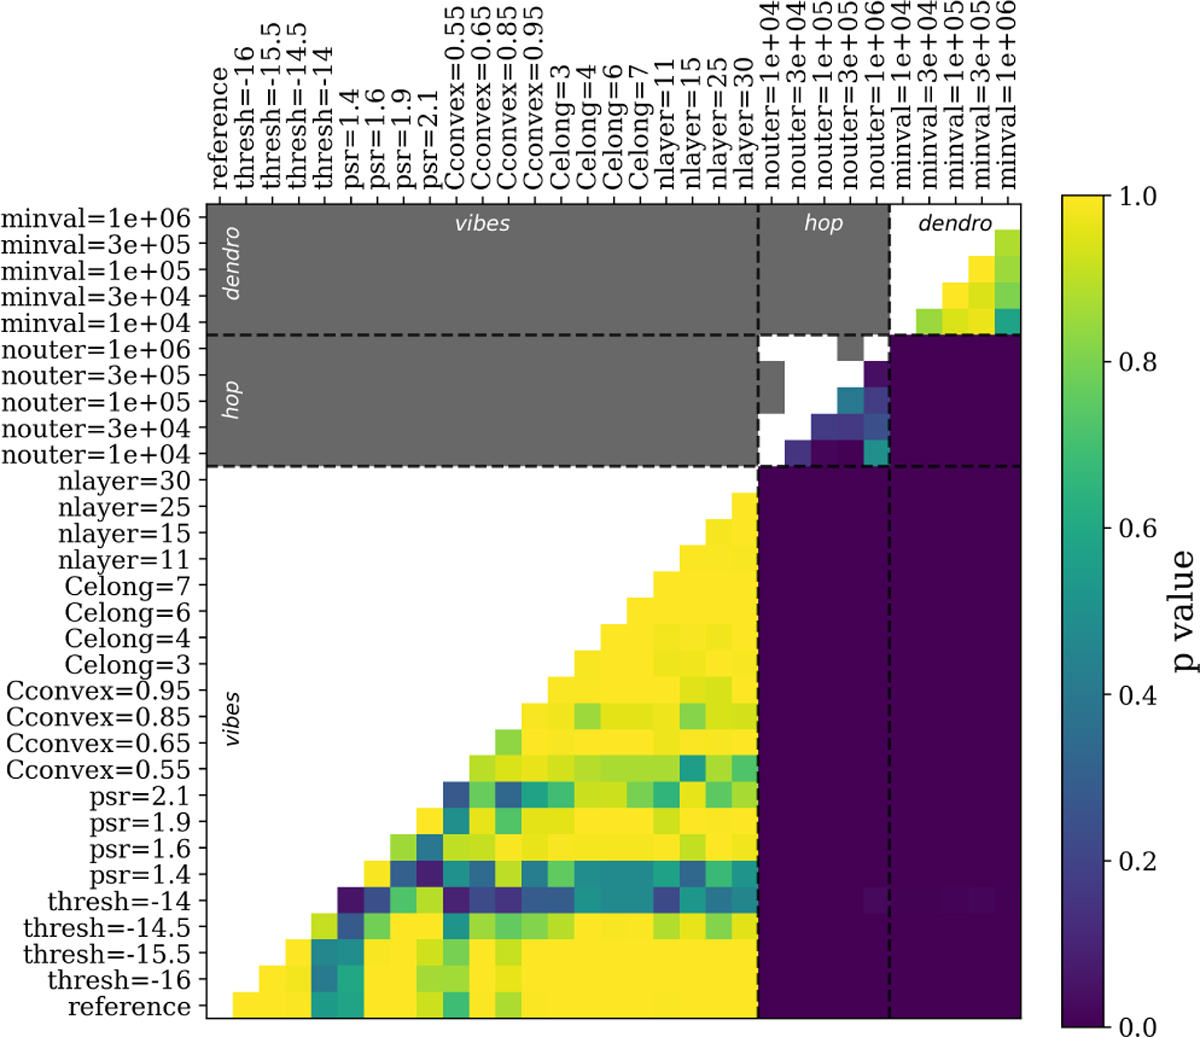
Matrix giving the p values for Kolmogorov-Smirnov tests comparing mass distributions obtained for different parameters. The lower triangle shows the p values and the upper triangle indicates whether the null hypothesis (i.e., same underlying mass distribution) is accepted (p > 0.05). Darkened pixels correspond to rejection of the null hypothesis. The legend gives the parameter variation for each extraction algorithm (see Table F.1 for vibes). The dashed black lines split the matrices with respect to the extraction tool: vibes, hop, and dendrogram.
Current usage metrics show cumulative count of Article Views (full-text article views including HTML views, PDF and ePub downloads, according to the available data) and Abstracts Views on Vision4Press platform.
Data correspond to usage on the plateform after 2015. The current usage metrics is available 48-96 hours after online publication and is updated daily on week days.
Initial download of the metrics may take a while.