


Fig. 10
Download original image
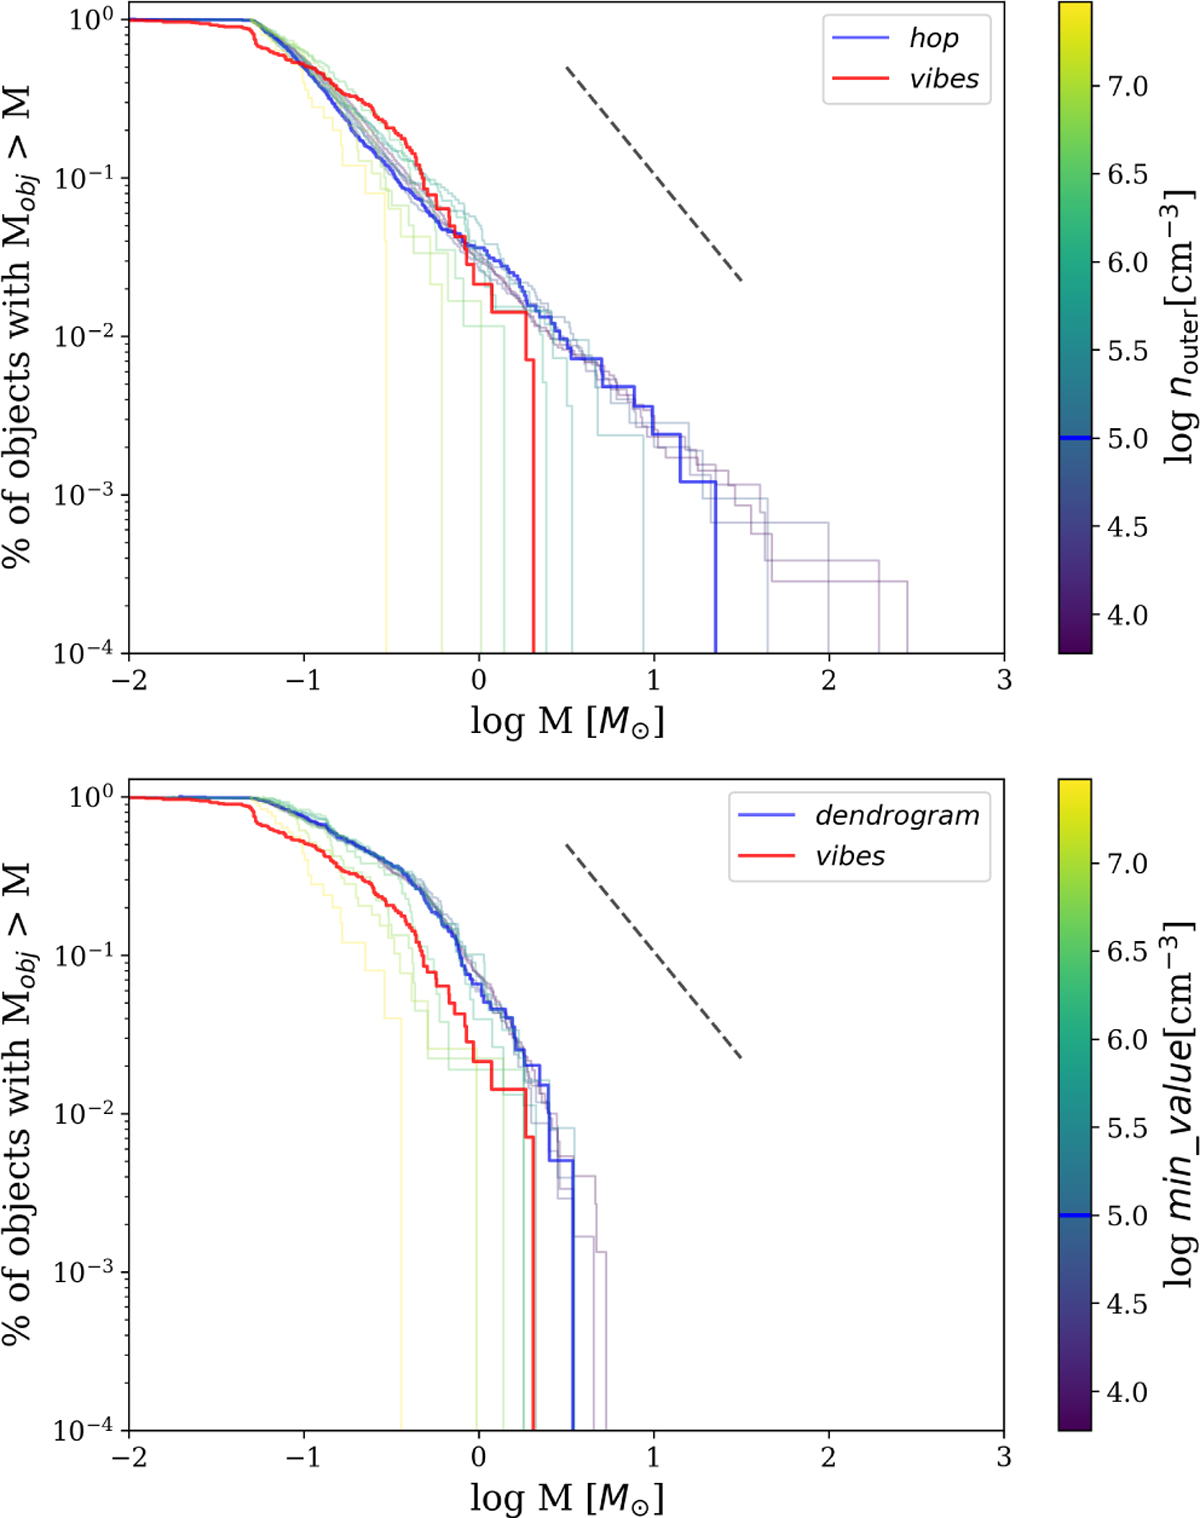
Mass distribution of the structures extracted with hop (top) and dendrogram (bottom) for different values of the density threshold parameter nouter and min_value, respectively. The hop and dendrogram ccdf for the fixed threshold parameter at 105 cm−3 are given in blue. The thin colored lines correspond to the mass ccdf for different values of the algorithm density threshold. The vibes mass ccdf is given in red. The dashed black line corresponds to Salpeter slope α = −1.35.
Current usage metrics show cumulative count of Article Views (full-text article views including HTML views, PDF and ePub downloads, according to the available data) and Abstracts Views on Vision4Press platform.
Data correspond to usage on the plateform after 2015. The current usage metrics is available 48-96 hours after online publication and is updated daily on week days.
Initial download of the metrics may take a while.