


Fig. 8
Download original image
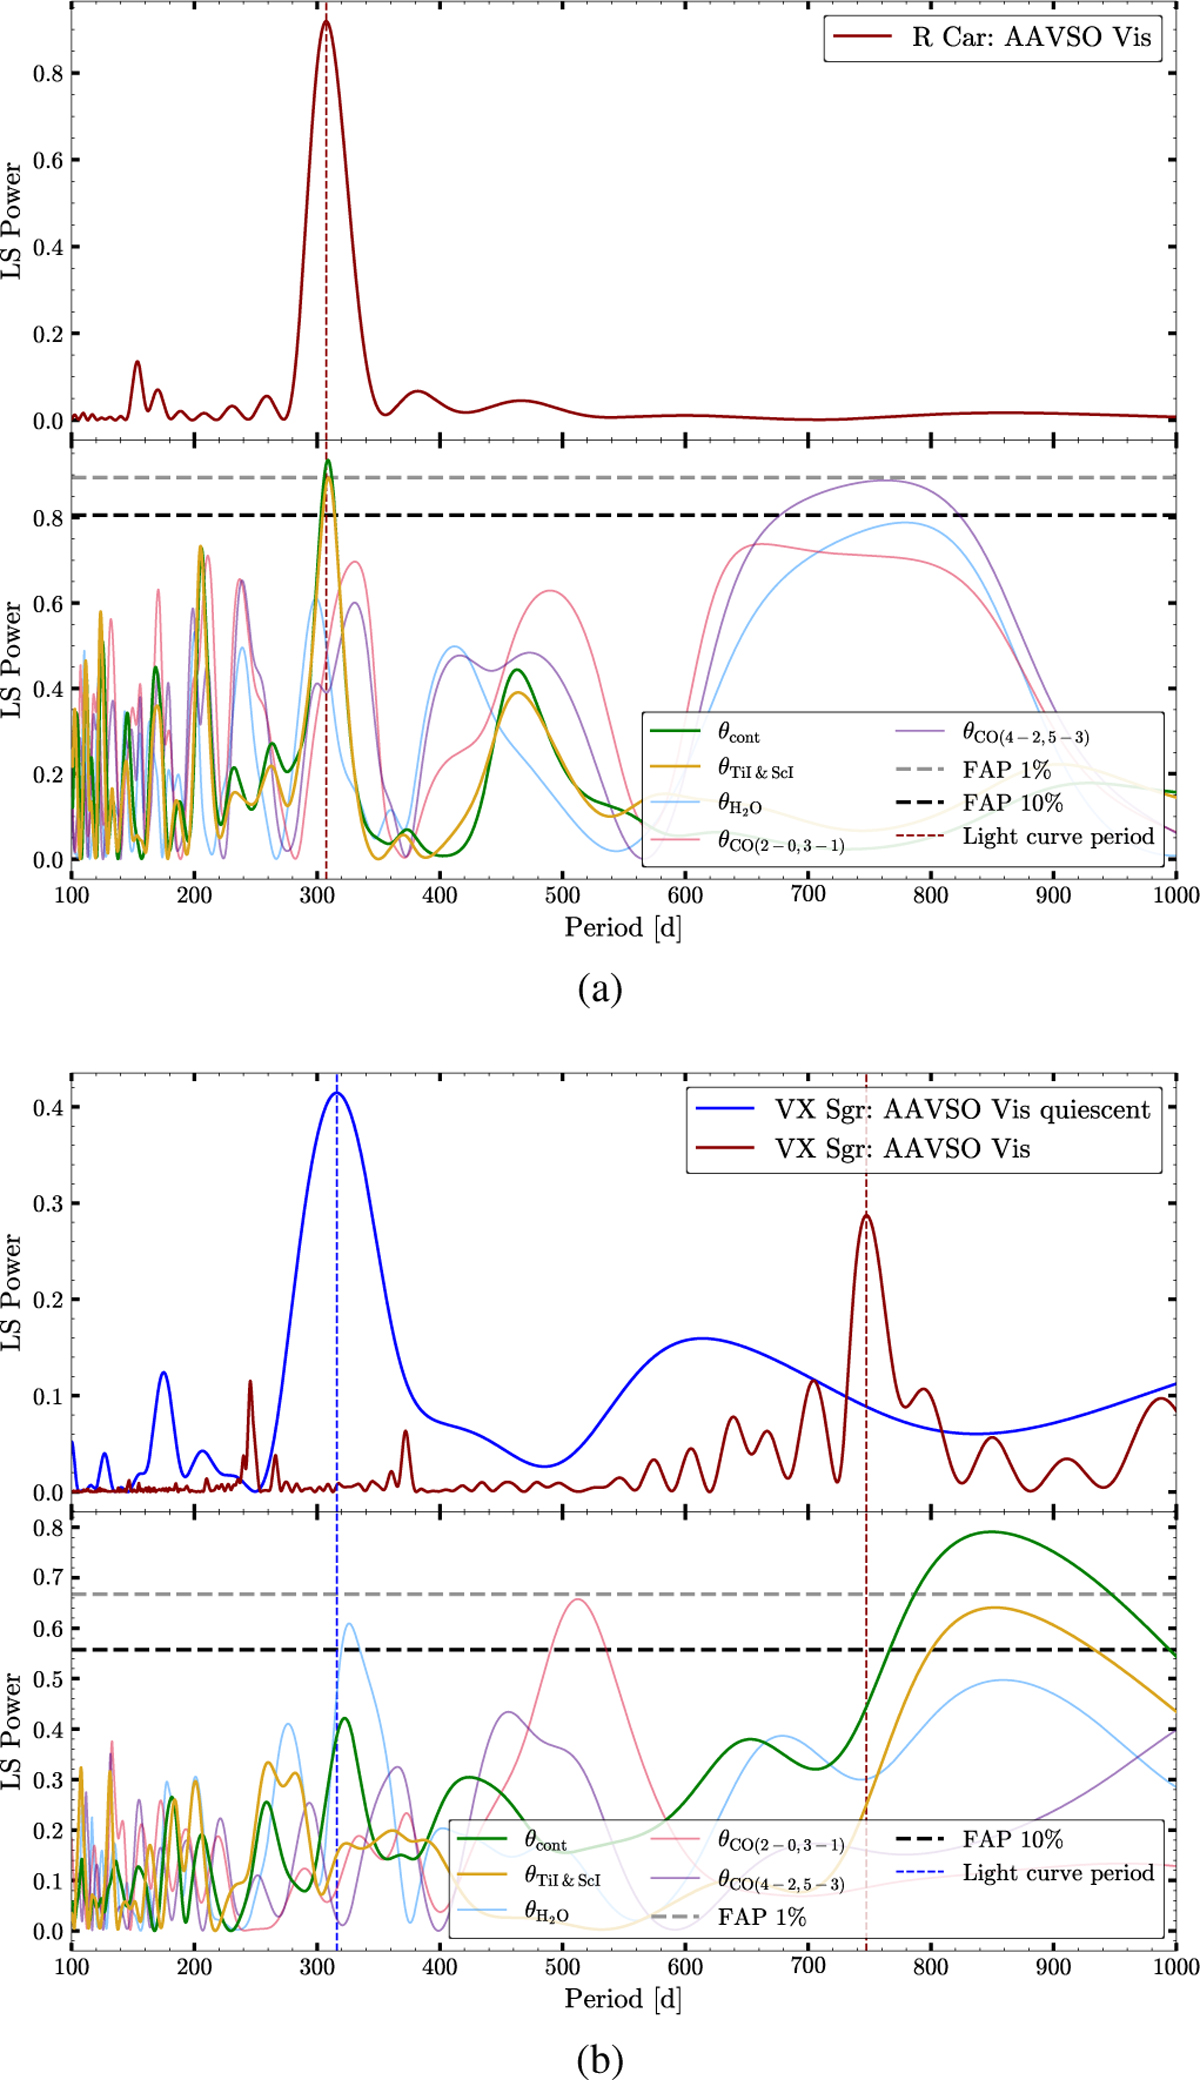
Lomb-Scargle normalized periodograms that we calculated for R Car (upper panels) and VX Sgr (lower panels). In the panels with diameters, we also highlight the false alarm probability (FAP; VanderPlas 2018) for levels of 1 and 10% (dashed gray and black lines) determined with astropy, which is one of the standard ways to judge peak significance. From our layers, usually only θcont and θTi I,Sc I reach the 1% threshold and show peaks similar to the AAVSO light curve. For VX Sgr, the LS periodogram is shown for the full dataset and the quiescent cycle.
Current usage metrics show cumulative count of Article Views (full-text article views including HTML views, PDF and ePub downloads, according to the available data) and Abstracts Views on Vision4Press platform.
Data correspond to usage on the plateform after 2015. The current usage metrics is available 48-96 hours after online publication and is updated daily on week days.
Initial download of the metrics may take a while.