


Fig. 6
Download original image
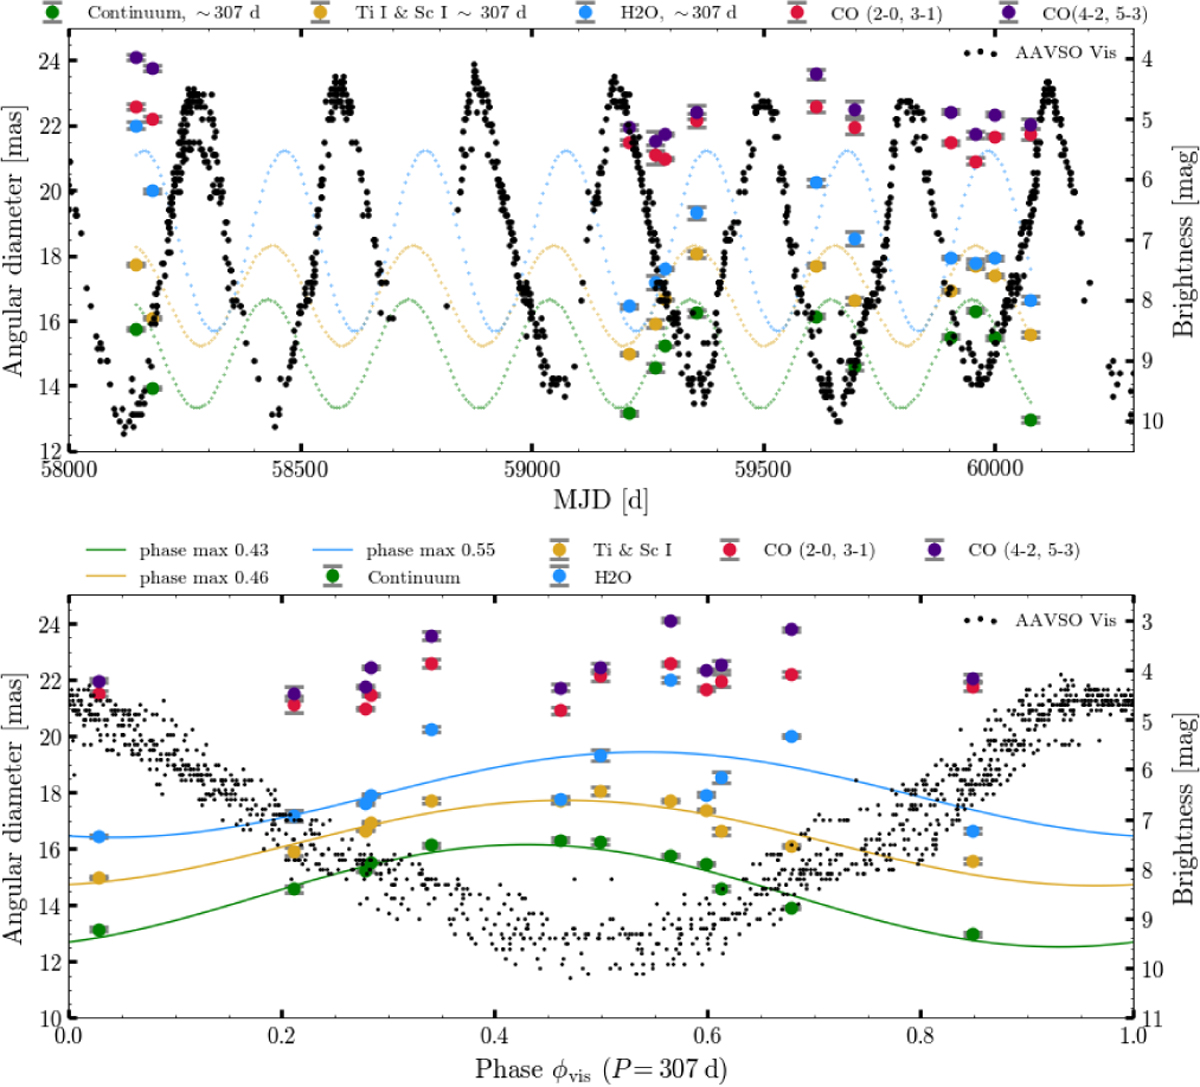
Upper panel: variability of R Car based on the visual magnitude from AAVSO data and the angular diameters determined with VLTI-GRAVITY (binned in 2-week intervals). For clarity, we merged CO bands θCO(2-0) with θCO(3-1) and θCO(4-2) with θCO(5-3). Different colors correspond to the continuum and to regions of the extended atmosphere. Lower panel: phase diagram of brightness and diameter variability. Solid lines represent the sine fits for P = 307.4 d (same colors as atmospheric layers). Phases φvis for which the fits to angular diameters reach maximum are denoted in the caption.
Current usage metrics show cumulative count of Article Views (full-text article views including HTML views, PDF and ePub downloads, according to the available data) and Abstracts Views on Vision4Press platform.
Data correspond to usage on the plateform after 2015. The current usage metrics is available 48-96 hours after online publication and is updated daily on week days.
Initial download of the metrics may take a while.