


Fig. 2
Download original image
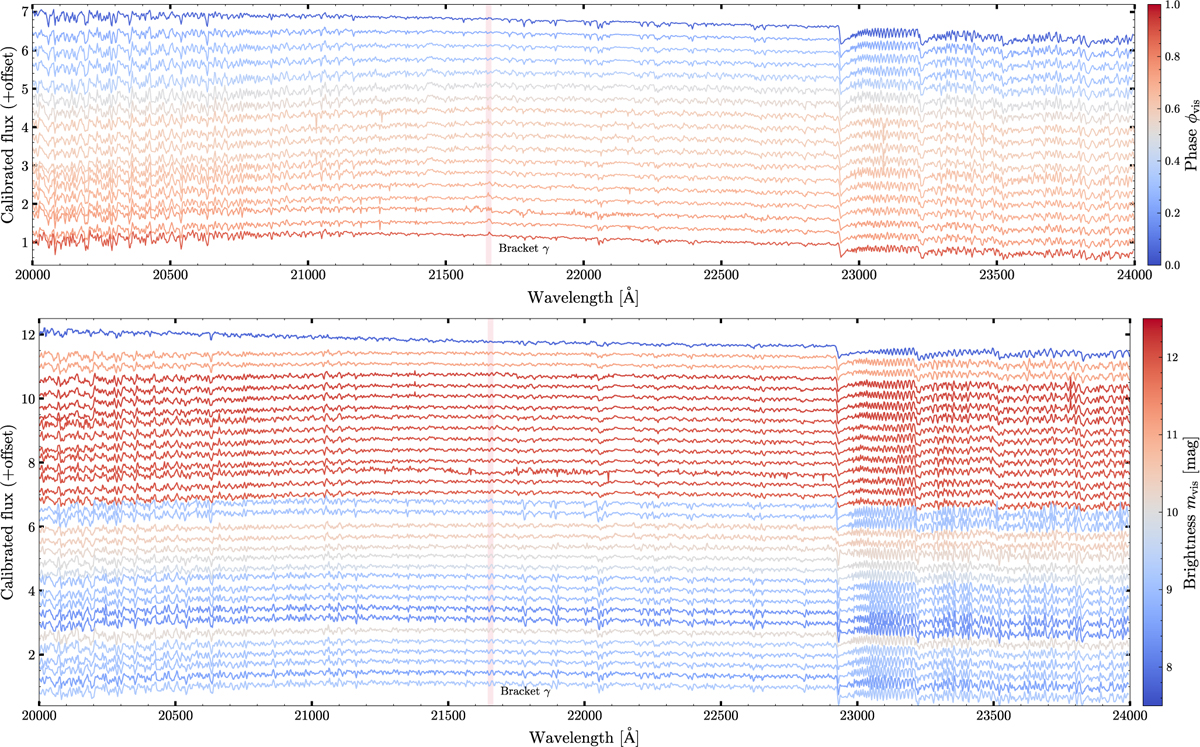
Variability of the flux (calibrated using the spectral transfer function) for all our observations. The spectra were divided by mean flux in the continuum region (2.22–2.28 μm). Upper panel: R Car. The spectra were vertically shifted, ordered, and color-coded by phase φvis (φvis = 0 corresponds to brightness maximum). Lower panel: same, but for VX Sgr. The spectra were vertically shifted, ordered by observation date, and color-coded by the nearest mvis values from AAVSO.
Current usage metrics show cumulative count of Article Views (full-text article views including HTML views, PDF and ePub downloads, according to the available data) and Abstracts Views on Vision4Press platform.
Data correspond to usage on the plateform after 2015. The current usage metrics is available 48-96 hours after online publication and is updated daily on week days.
Initial download of the metrics may take a while.