


Fig. B.1.
Download original image
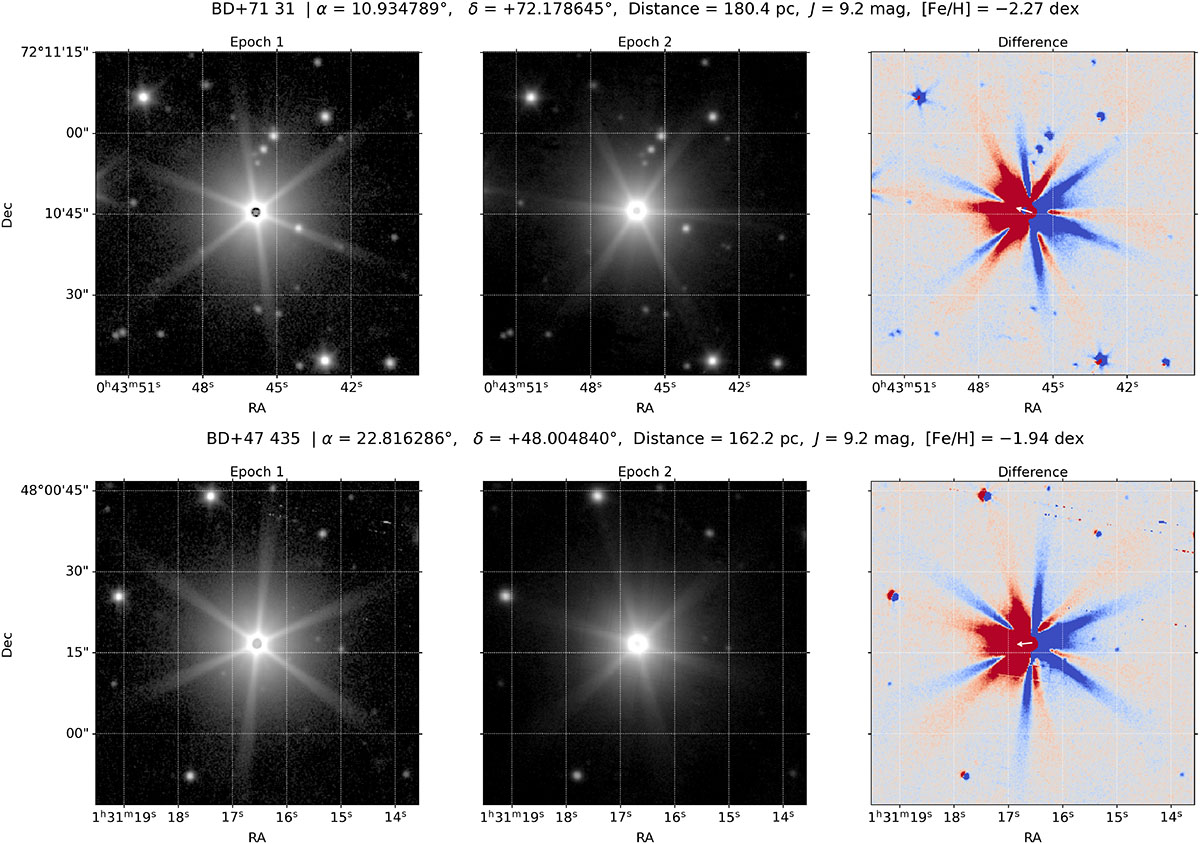
GTC/EMIR J-band images of the 21 targets in two epochs and the difference (red positive, blue negative). The two-epoch images are normalised and then stretched on a logarithmic scale to better visualise the faint sources around the central star. White arrow in the difference image indicates the proper motion direction of the star. For clarity, the arrow length is three times the motion during the baseline between the two epochs. All images are centred at the star position at the first epoch with an FoV of 1′ × 1′.
Current usage metrics show cumulative count of Article Views (full-text article views including HTML views, PDF and ePub downloads, according to the available data) and Abstracts Views on Vision4Press platform.
Data correspond to usage on the plateform after 2015. The current usage metrics is available 48-96 hours after online publication and is updated daily on week days.
Initial download of the metrics may take a while.