


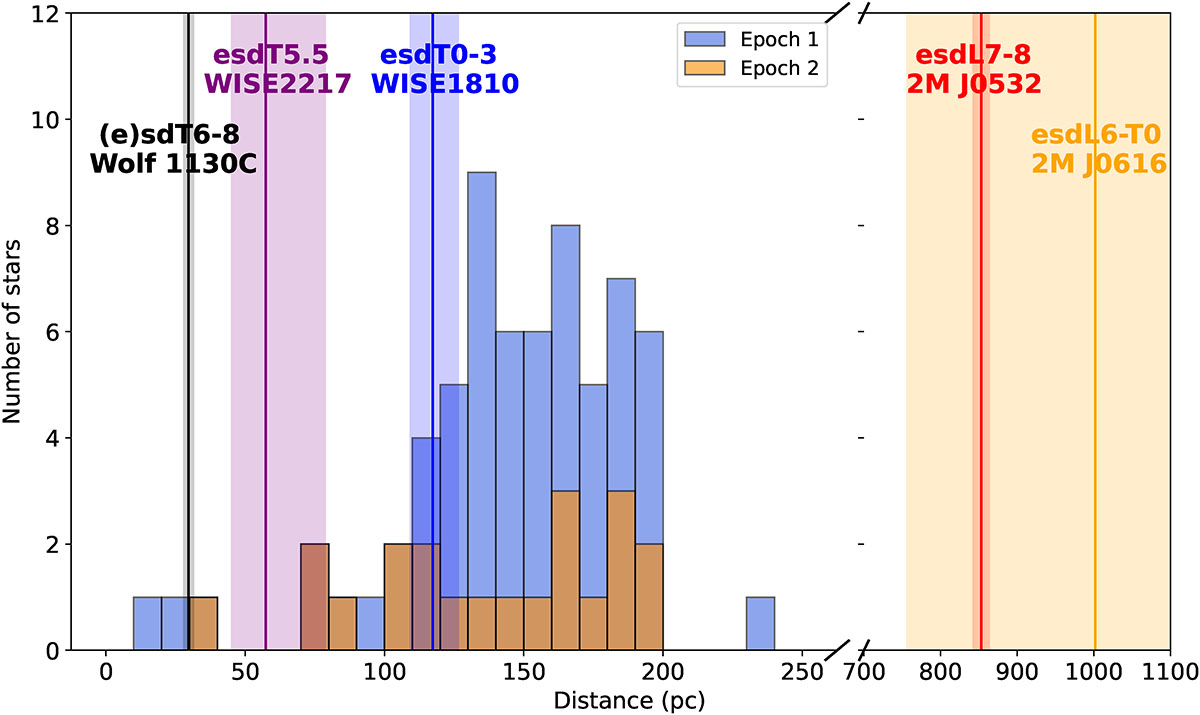
Fig. 2.
Download original image
Target distance histogram compared with maximum detectable distances (solid coloured lines) for different spectral types of extreme subdwarfs with low metallicities at the first-epoch GTC/EMIR J-band depth of 22.8 mag. The coloured shades indicate the uncertainty of the maximum detectable distances, which mainly result from the uncertainties of the parallax measurements.
Current usage metrics show cumulative count of Article Views (full-text article views including HTML views, PDF and ePub downloads, according to the available data) and Abstracts Views on Vision4Press platform.
Data correspond to usage on the plateform after 2015. The current usage metrics is available 48-96 hours after online publication and is updated daily on week days.
Initial download of the metrics may take a while.