


Fig. 4.
Download original image
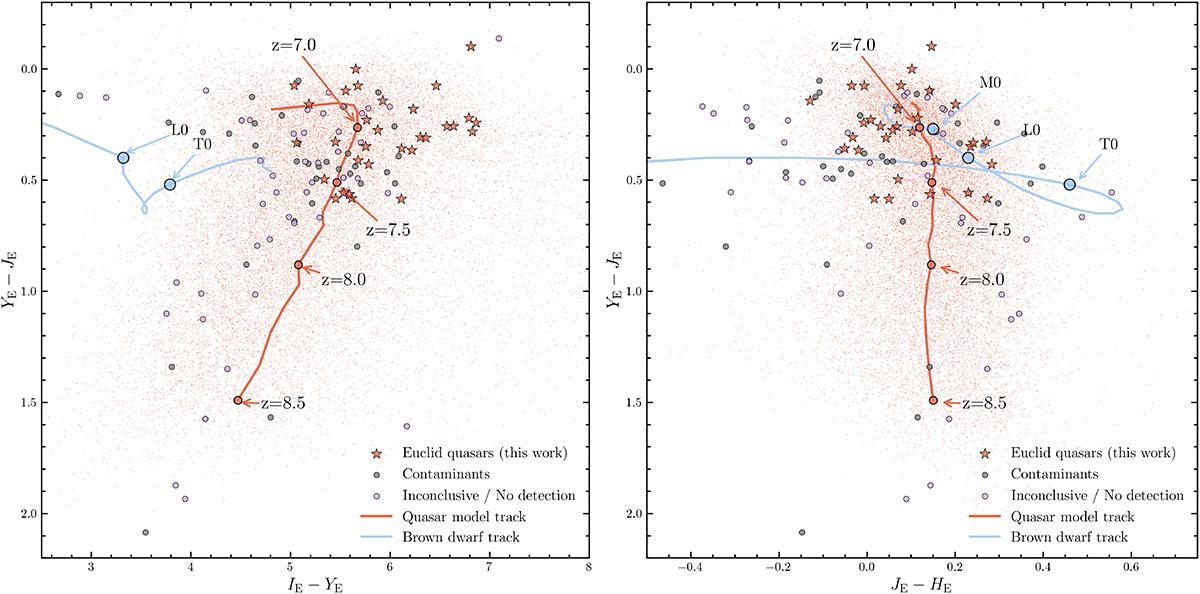
Colour-colour diagrams of newly discovered quasars and other candidates. Left: IE − YE versus YE − JE colour-colour diagram. Right: JE − HE versus YE − JE colour-colour diagram. The red stars mark the new Euclid quasars presented in this work, the grey circles denote the identified contaminants, and the violet circles are those marked as inconclusive or no detection (see Sect. 5.2). The red curve indicates the mean colour track of high-z quasars based on the synthetic quasar samples (the red points; Yang et al., in prep.), with redshifts of 7.0, 7.5, 8.0, and 8.5 annotated. The light blue curve represents the empirical brown-dwarf colour track from Euclid Collaboration: Barnett et al. (2019), with selected spectral types (M0, L0, T0) labelled.
Current usage metrics show cumulative count of Article Views (full-text article views including HTML views, PDF and ePub downloads, according to the available data) and Abstracts Views on Vision4Press platform.
Data correspond to usage on the plateform after 2015. The current usage metrics is available 48-96 hours after online publication and is updated daily on week days.
Initial download of the metrics may take a while.