


Fig. A.3
Download original image
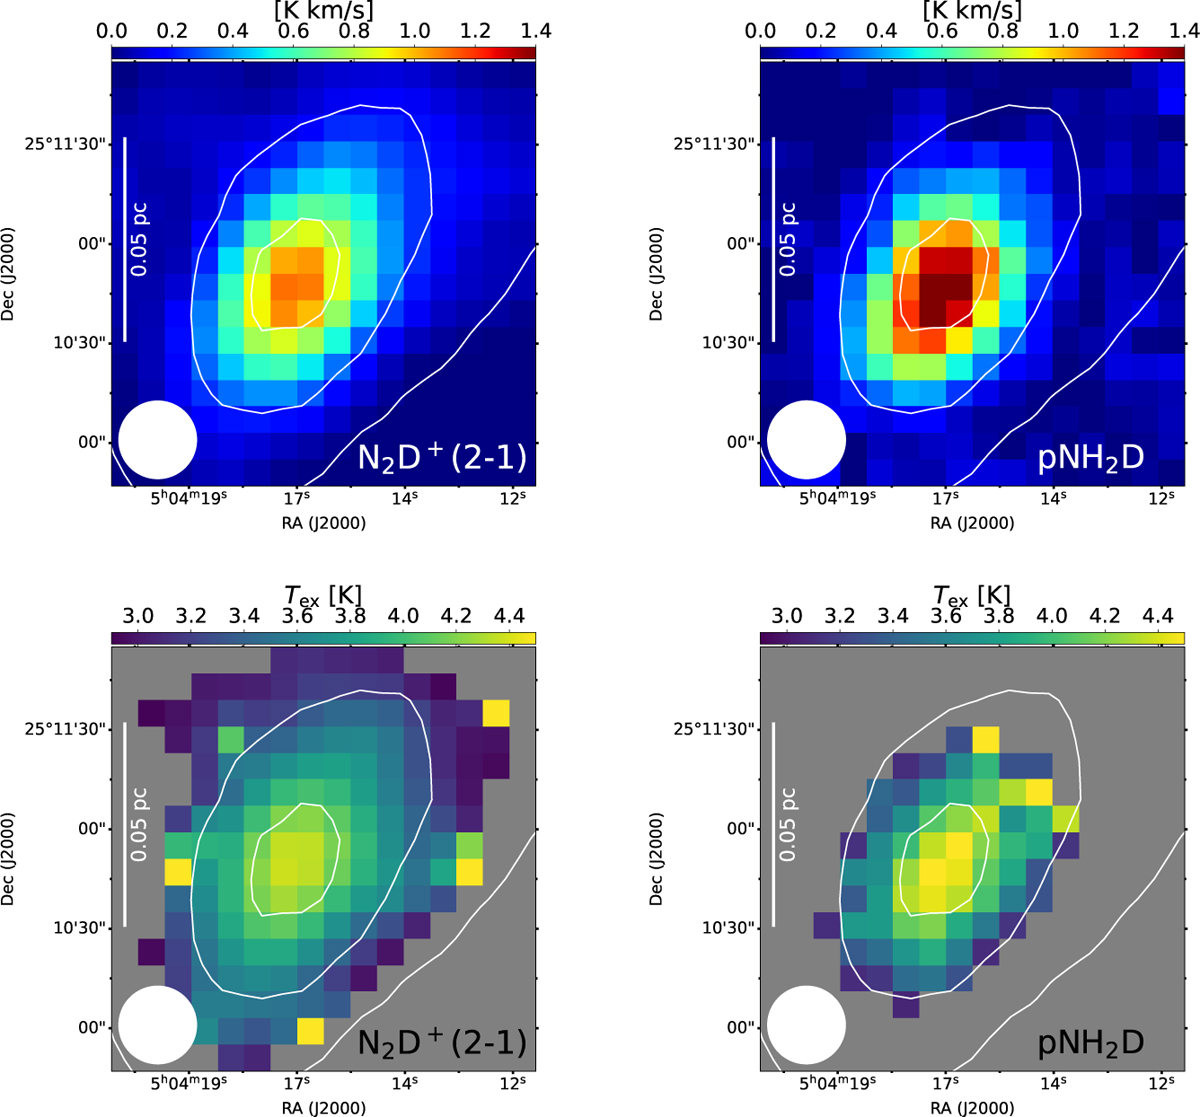
Top: Integrated intensity maps for N2D+ (left) and pNH2D (right). Bottom: Excitation temperature (Tex) maps derived from pixel-per-pixel fitting of the N2D+ (left) and pNH2D ( right) spectra with p y speckit (cf. Section 4). The white contours at 0.8, 1.7, and 2.5 × 1022 cm−2 trace the gas column density as derived from Herschel data (from Spezzano et al. 2017) and are the same on all panels. The white filled circles show the 23″.5 beam size (0.019 pc at the 170 pc distance of L1544) and the white vertical lines indicate the 0.05 pc scale.
Current usage metrics show cumulative count of Article Views (full-text article views including HTML views, PDF and ePub downloads, according to the available data) and Abstracts Views on Vision4Press platform.
Data correspond to usage on the plateform after 2015. The current usage metrics is available 48-96 hours after online publication and is updated daily on week days.
Initial download of the metrics may take a while.