


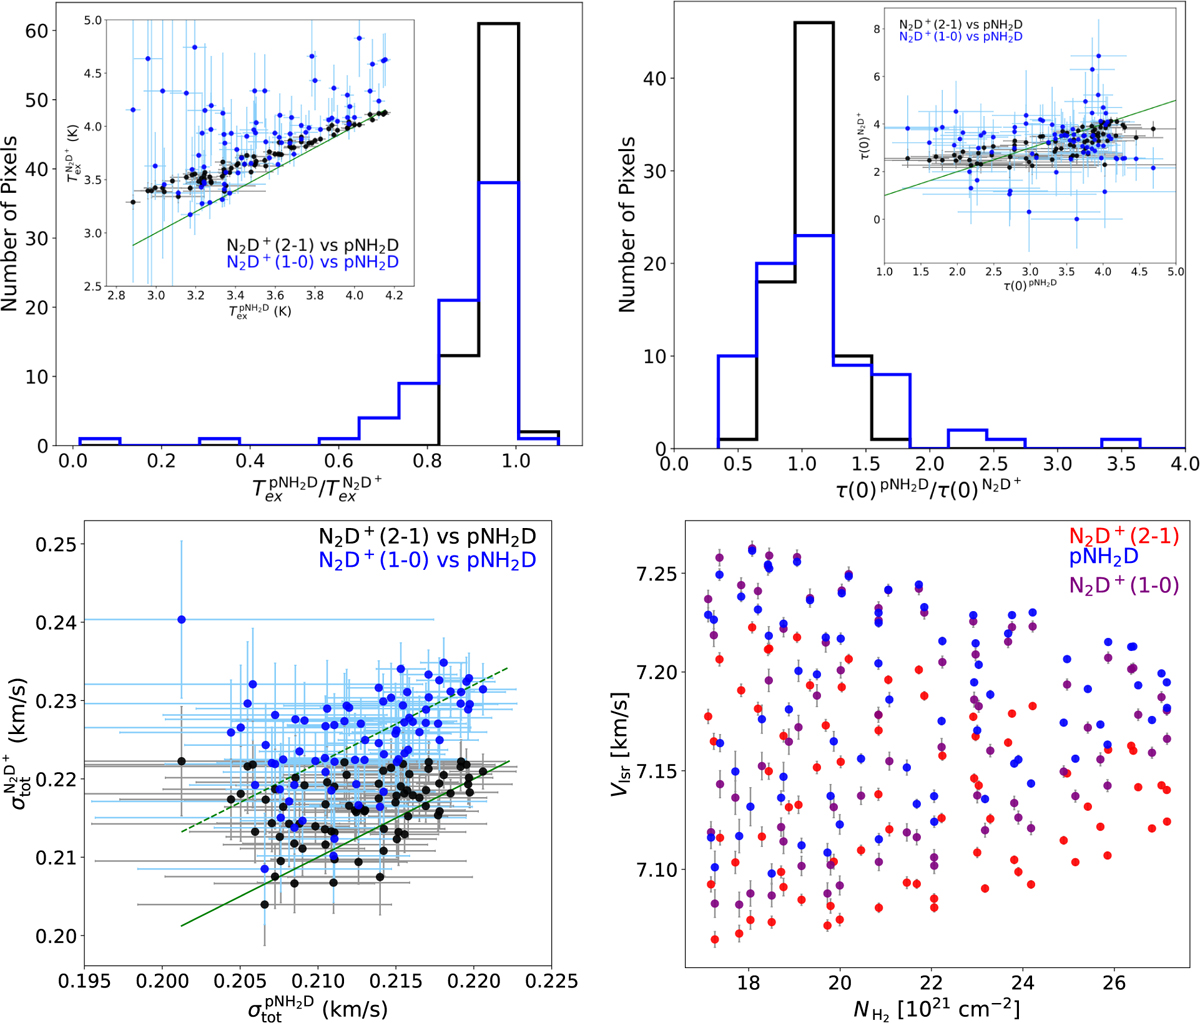
Fig. C.1
Download original image
Top-left: Histrograms of the  ratio values, where the ion is N2D+(2 – 1) in black and N2D+(1-0) in blue. The velocity data cubes are all smoothed to the spatial resolution of N2D+(1 – 0) with HPBW of 34″. The mean and standard deviation of the distributions are given in Table C.1. The inset shows the scatter plot of the Tex values and their uncertainties. The oblique line indicates the 1:1 relation. Top-right: Similar as the top-left panel for the τ values. Bottom-left: Scatter plot of the velocity dispersion. The oblique solid and dashed blue lines indicate the 1:1 and the 0.012 km/s relations, respectively. Bottom-right: Scatter plot of the centroid velocity of N2D+(2 – 1) in red, pNH2D in blue, and N2D+(1 – 0) in purple versus the
  column density derived from Herschel for data points with NH2 > 1.7 × 1022 cm−2. The vertical gray lines show the fitting uncertainties of Vlsr.
Current usage metrics show cumulative count of Article Views (full-text article views including HTML views, PDF and ePub downloads, according to the available data) and Abstracts Views on Vision4Press platform.
Data correspond to usage on the plateform after 2015. The current usage metrics is available 48-96 hours after online publication and is updated daily on week days.
Initial download of the metrics may take a while.