


Fig. 1
Download original image
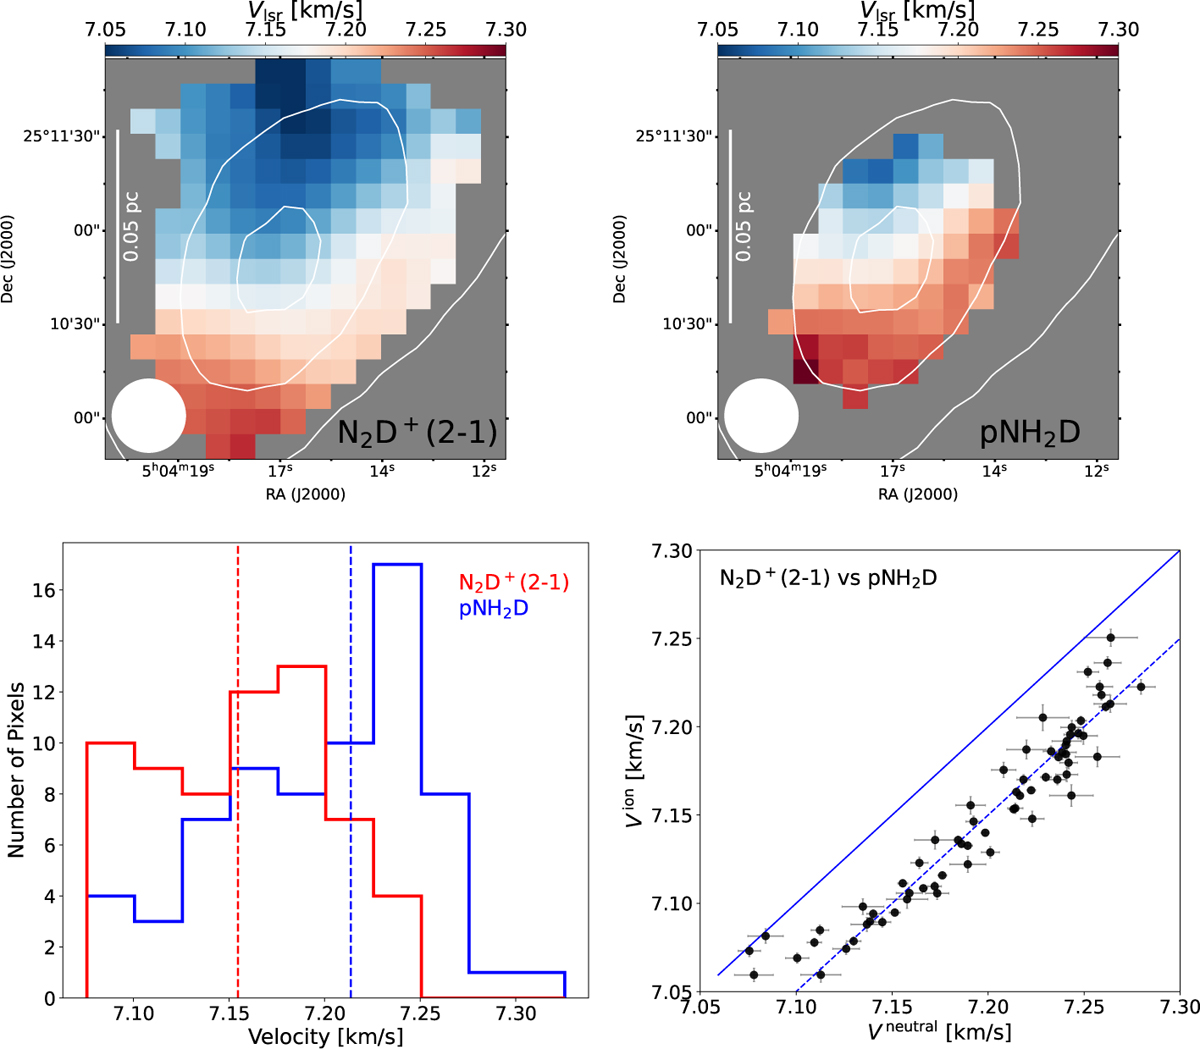
Centroid velocity maps derived from pixel-per-pixel fitting of the N2 D+ ( top left) and pNH2D (top right) spectra with pyspeckit (cf. Section 4). The white contours at 0.8, 1.7, and 2.5 × 1022 cm−2 trace the gas column density as derived from Herschel data (from Spezzano et al. 2017) and are the same on both panels. The white filled circles show the 23″.5 beam size (0.019 pc at the 170pc distance of L1544) and the white vertical lines indicate the 0.05 pc scale. The excitation temperature maps are shown in Appendix A. The bottom plots show the distribution of the velocity for N2D+ in red and pNH2D in blue (bottom left) and a scatter plot (bottom right). The median values of the distributions indicated by the vertical dashed lines are 7.16 km/s for N2D+ and 7.21 km/s for pNH2D. The oblique solid and dashed blue lines indicate the 1:1 and the −0.05 km/s relations, respectively. The gray error bars on the scatter plot are the ±1σ uncertainties on the centroid velocities derived from the pyspeckit fit. The mean values of these uncertainties are 0.003 and 0.006 km/s for the N2D+ and pNH2D data points, respectively (the histograms of the uncertainties are presented in Appendix A).
Current usage metrics show cumulative count of Article Views (full-text article views including HTML views, PDF and ePub downloads, according to the available data) and Abstracts Views on Vision4Press platform.
Data correspond to usage on the plateform after 2015. The current usage metrics is available 48-96 hours after online publication and is updated daily on week days.
Initial download of the metrics may take a while.