


Fig. 8
Download original image
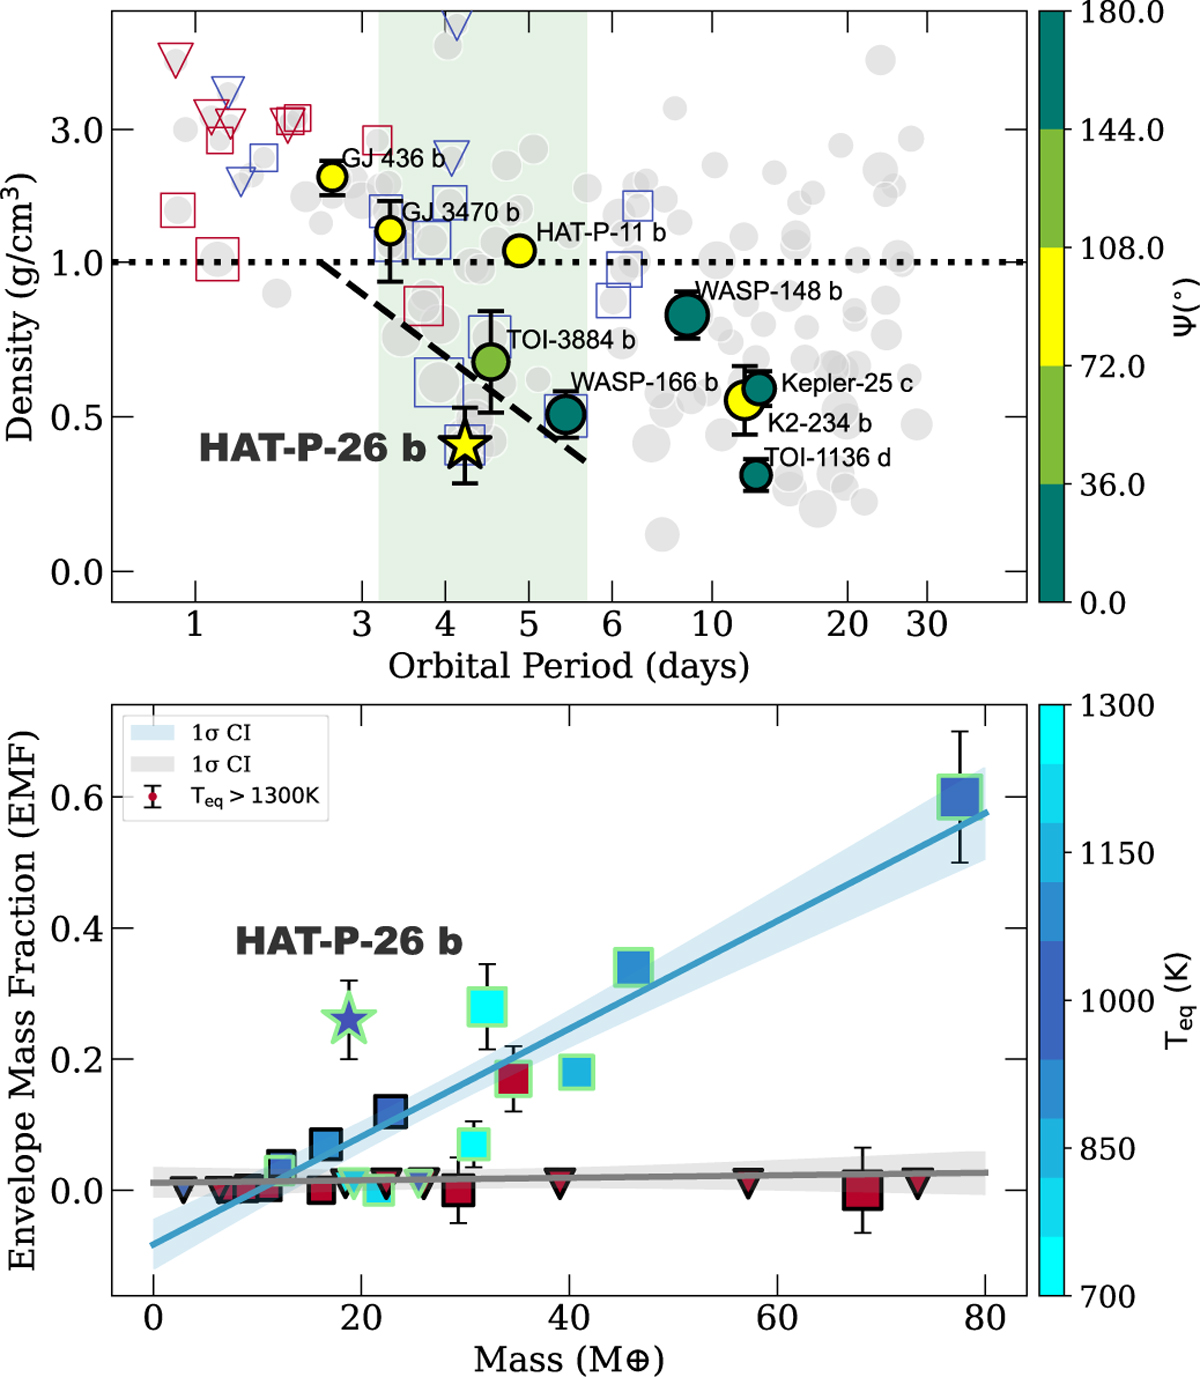
Density distribution versus orbital period (top) and EMF versus planetary mass (bottom) for close-in Neptunes. In the top panel, all close-in Neptunes (3.5 R⊕ < Rp < 8.5R⊕, P < 30 days) are shown as grey dots with symbol size scaled to planetary radius. A subset with available 3D spin–orbit measurements is highlighted using distinct face colors, and planets on polar orbits (72°-108°) are emphasized in yellow. The Neptunian sample with EMF estimates from Doyle et al. (2025) is indicated by the blue and red boxes, as illustrated in the bottom panel. A dotted line marks the bulk-density level of 1 g cm−3, and the approximate brink boundary proposed by Bourrier et al. (2025) is shown as a dashed line. The ridge corresponds to the green-shaded region. In the bottom panel, the warmer Neptunes (Teff> 1300 K; red squares) have EMF values close to zero, indicating almost no surviving envelopes. While, the cooler sample (Teff ≤ 1300 K; gradient blue squares), as proposed by Doyle et al. (2025), follows the linear trend (solid blue line). Samples with only EMF upper limits are marked by triangles, and ridge planets are highlighted with light green outlines.
Current usage metrics show cumulative count of Article Views (full-text article views including HTML views, PDF and ePub downloads, according to the available data) and Abstracts Views on Vision4Press platform.
Data correspond to usage on the plateform after 2015. The current usage metrics is available 48-96 hours after online publication and is updated daily on week days.
Initial download of the metrics may take a while.