


Fig. 6
Download original image
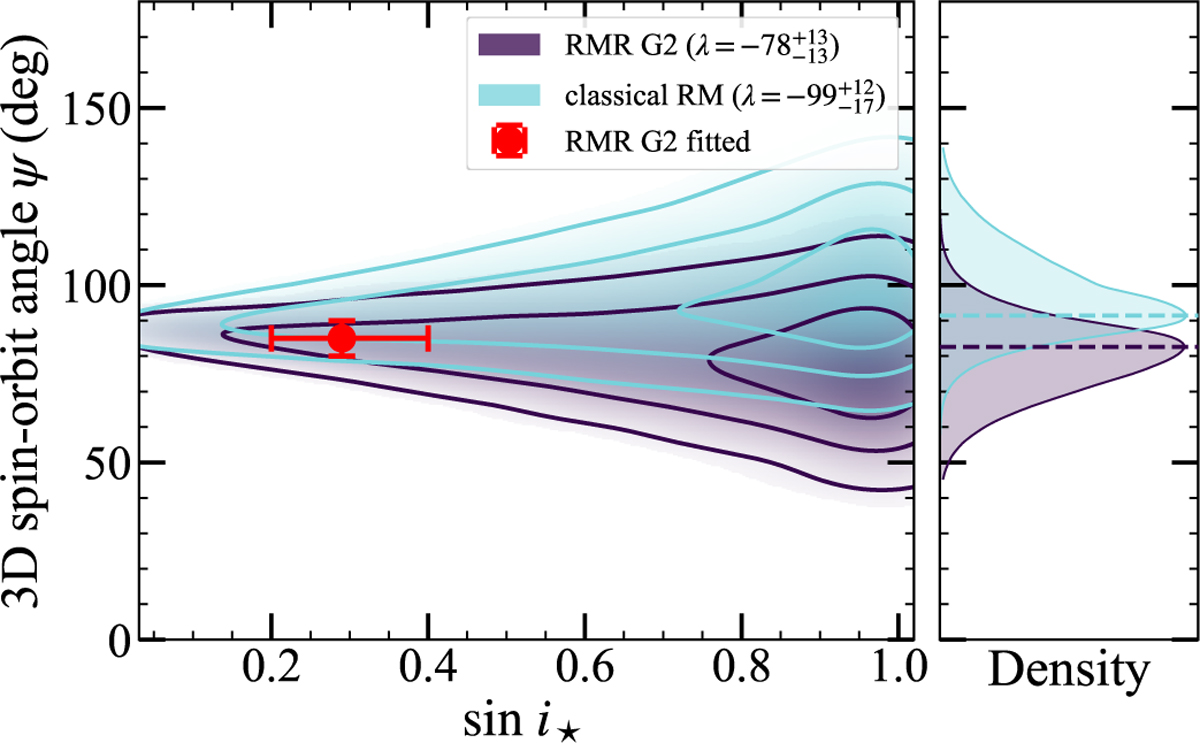
Posterior distribution of the 3D spin–orbit angle ψ, derived by assuming a uniform prior on cos i⋆ (random stellar spin axis orientation). The purple and blue density contours represent the posterior distributions of ψ under the projected obliquity constraints from the RMR analysis and the classical RM analysis respectively, while the solid curves mark the 1, 2, and 3σ credible regions. The red point indicates the ψ value obtained from the RMR G2 fit. The side panel shows the 1D marginal posteriors of ψ. Both distributions consistently favor a polar orbital configuration.
Current usage metrics show cumulative count of Article Views (full-text article views including HTML views, PDF and ePub downloads, according to the available data) and Abstracts Views on Vision4Press platform.
Data correspond to usage on the plateform after 2015. The current usage metrics is available 48-96 hours after online publication and is updated daily on week days.
Initial download of the metrics may take a while.