


Fig. E.2
Download original image
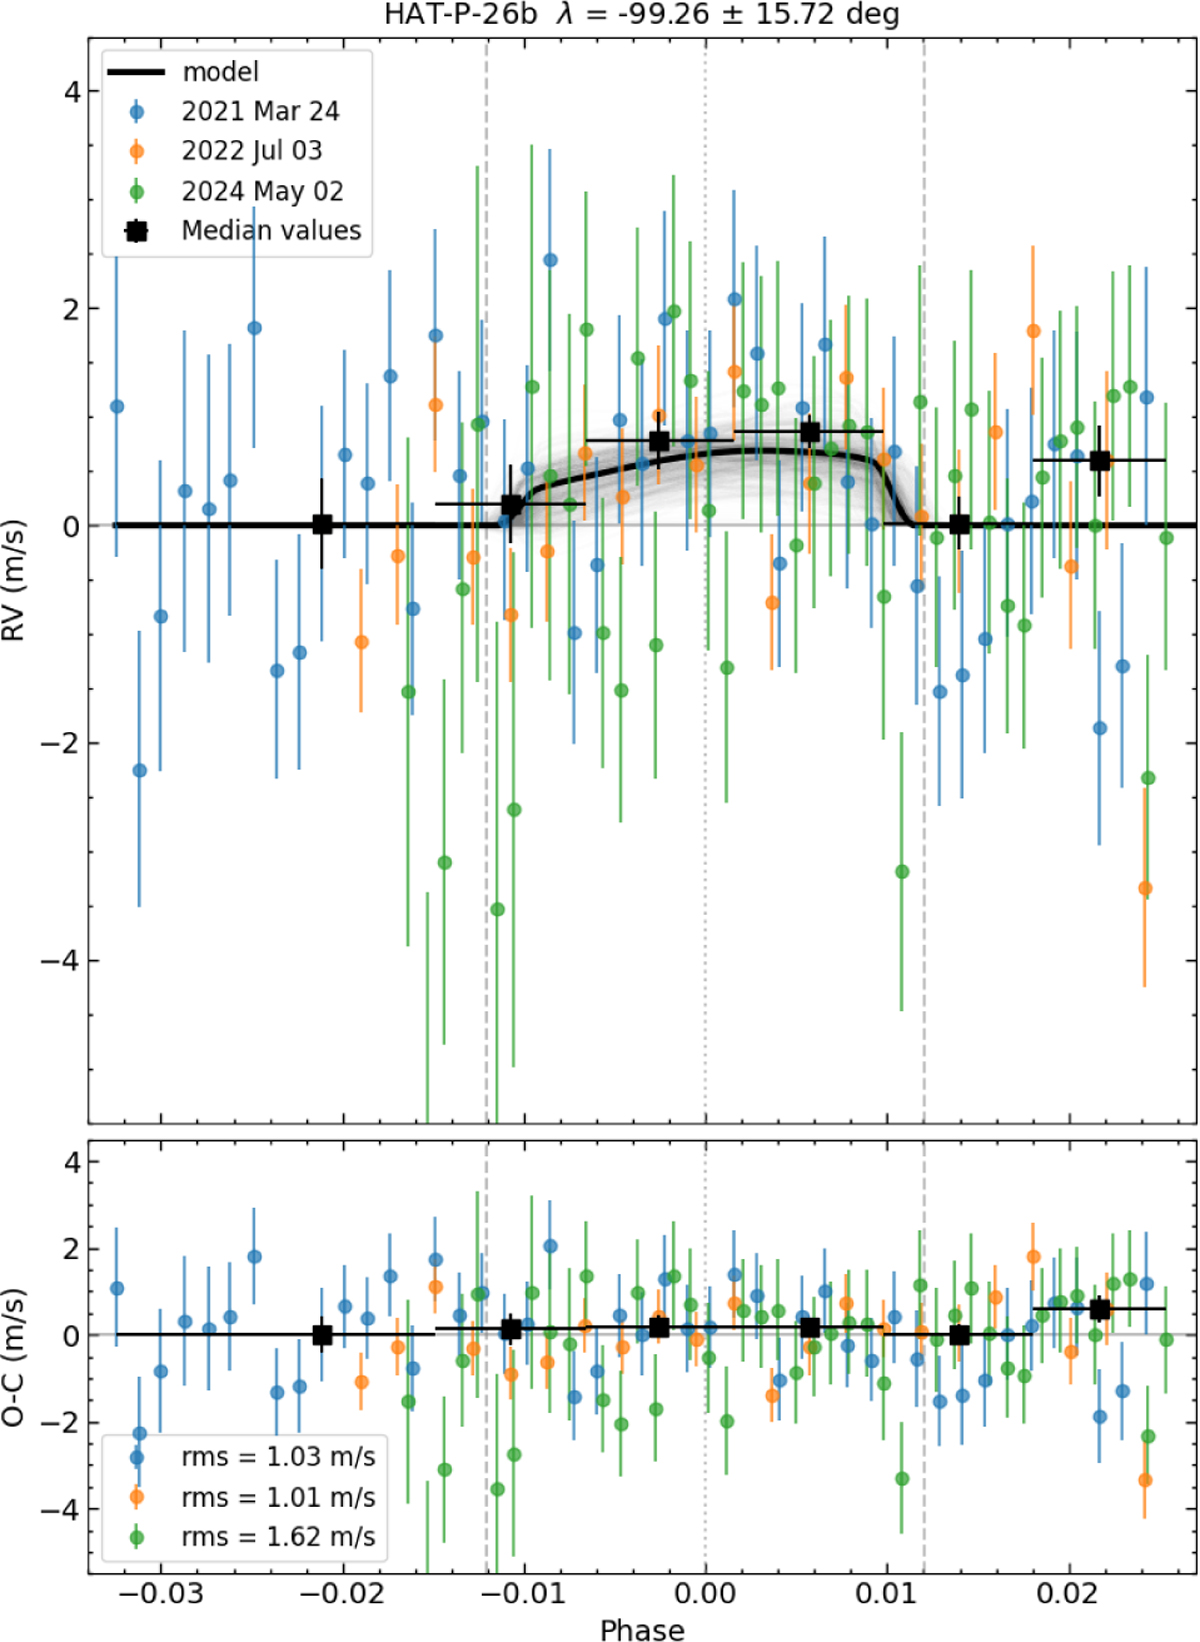
Top: Flattened radial velocities of HAT-P-26 b (colored dots) as a function of planetary orbital phase, together with the best-fit model obtained with ARoME (solid black line). The black squares represent the median radial velocities, while the grey-shaded area corresponds to the 1 σ uncertainty of the model. The vertical dashed lines indicate the planetary ingress and egress phases. Bottom: Observed minus computed data.
Current usage metrics show cumulative count of Article Views (full-text article views including HTML views, PDF and ePub downloads, according to the available data) and Abstracts Views on Vision4Press platform.
Data correspond to usage on the plateform after 2015. The current usage metrics is available 48-96 hours after online publication and is updated daily on week days.
Initial download of the metrics may take a while.