


Fig. 2
Download original image
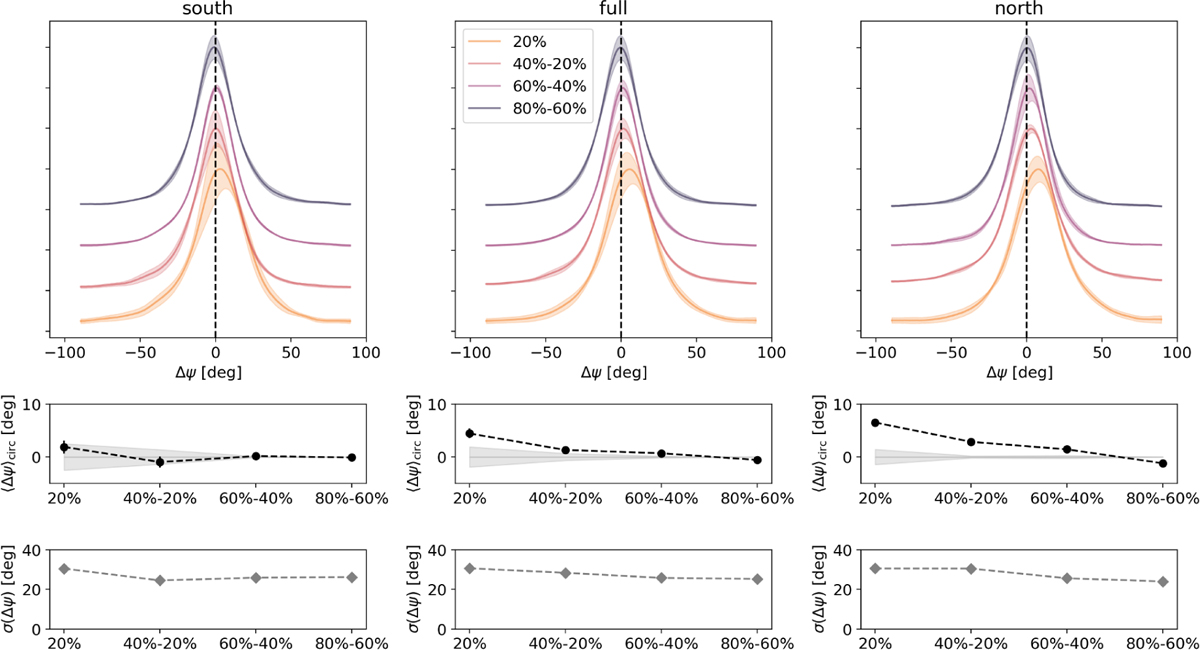
Normalized probability distribution functions of Δψ between Planck data at 353 GHz and the H I templates. The value of Δψ is computed for different sky masks at angular and pixel resolutions of 80' and Nside = 128, respectively. The NPDFs are shown for both Galactic hemispheres combined (central panels) and for the southern (left panels) and northern (right panels) hemispheres individually. The corresponding circular-mean values (in black circles) and their standard deviations (in gray diamonds) are shown in the insets at the bottom as a function of the sky mask. The gray shaded area in the middle panels represents the misalignment angle caused by systematic differences between SRoll2 and PR4 data.
Current usage metrics show cumulative count of Article Views (full-text article views including HTML views, PDF and ePub downloads, according to the available data) and Abstracts Views on Vision4Press platform.
Data correspond to usage on the plateform after 2015. The current usage metrics is available 48-96 hours after online publication and is updated daily on week days.
Initial download of the metrics may take a while.