


Fig. 8.
Download original image
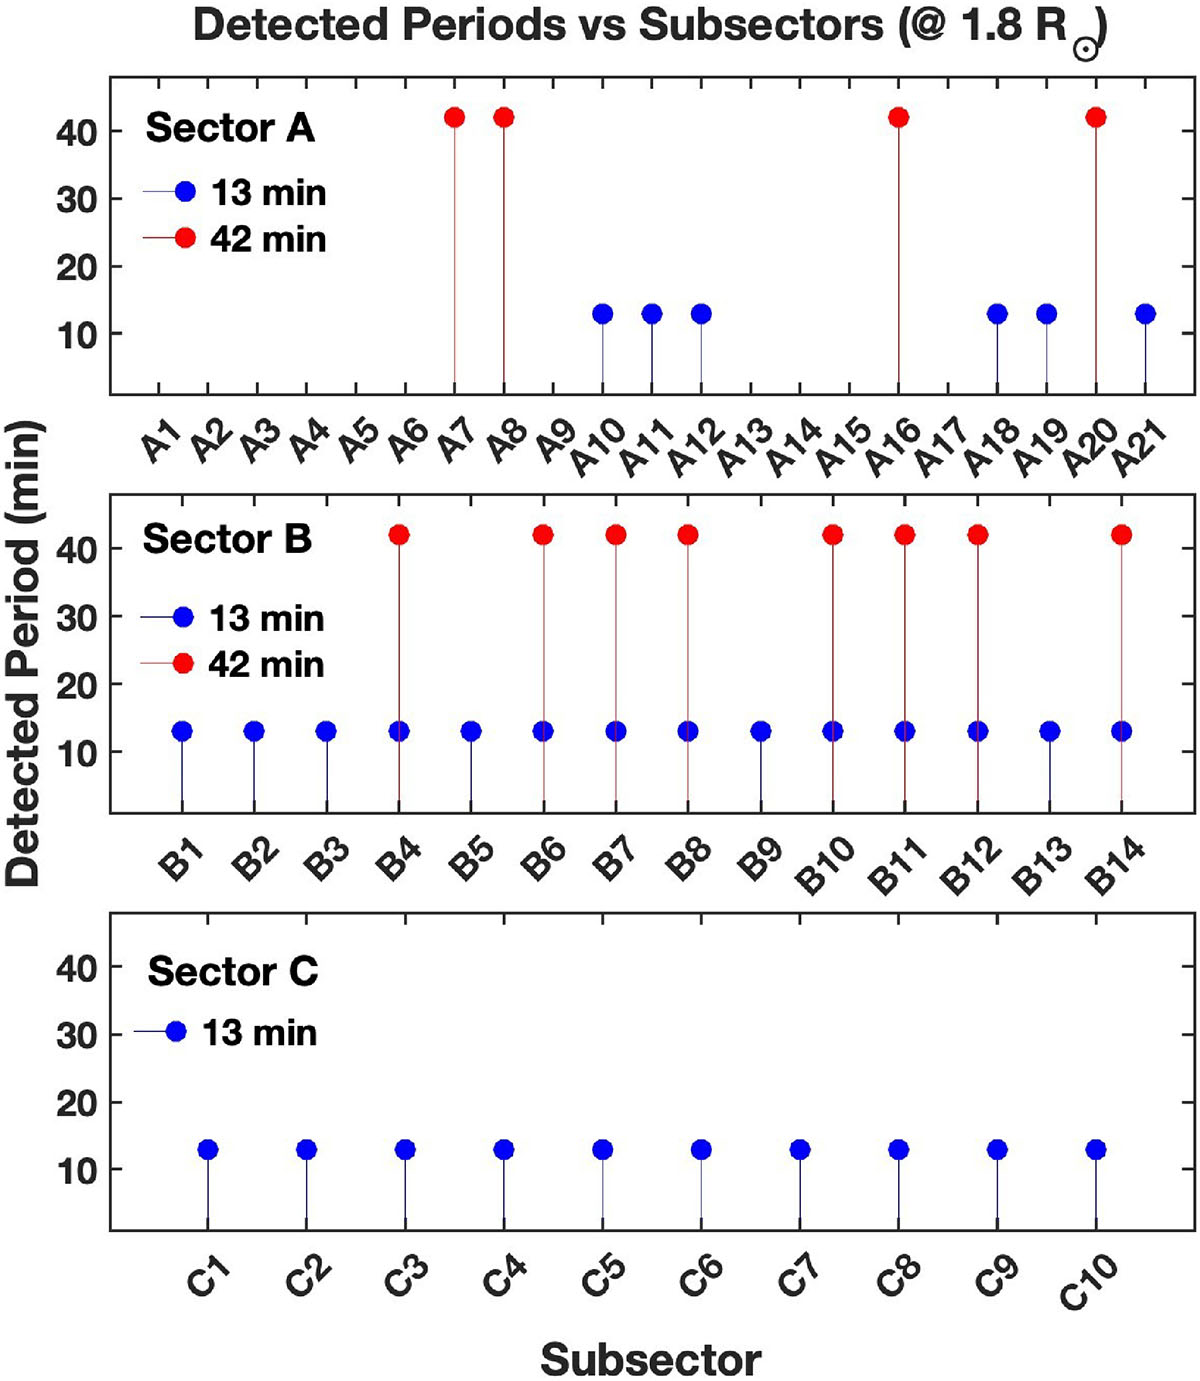
Synoptic view of the results of the spectral analysis performed for each subsector of sectors A (top panel), B (middle panel), and C (bottom panel) at 1.8 R⊙. The subsectors are labeled according to Table 2, and the reported periodicities are those with a confidence level of at least 95%. As indicated in each panel, the blue and red bullets refer to the 13 min and 42 min periodicities, respectively.
Current usage metrics show cumulative count of Article Views (full-text article views including HTML views, PDF and ePub downloads, according to the available data) and Abstracts Views on Vision4Press platform.
Data correspond to usage on the plateform after 2015. The current usage metrics is available 48-96 hours after online publication and is updated daily on week days.
Initial download of the metrics may take a while.