


Fig. 7.
Download original image
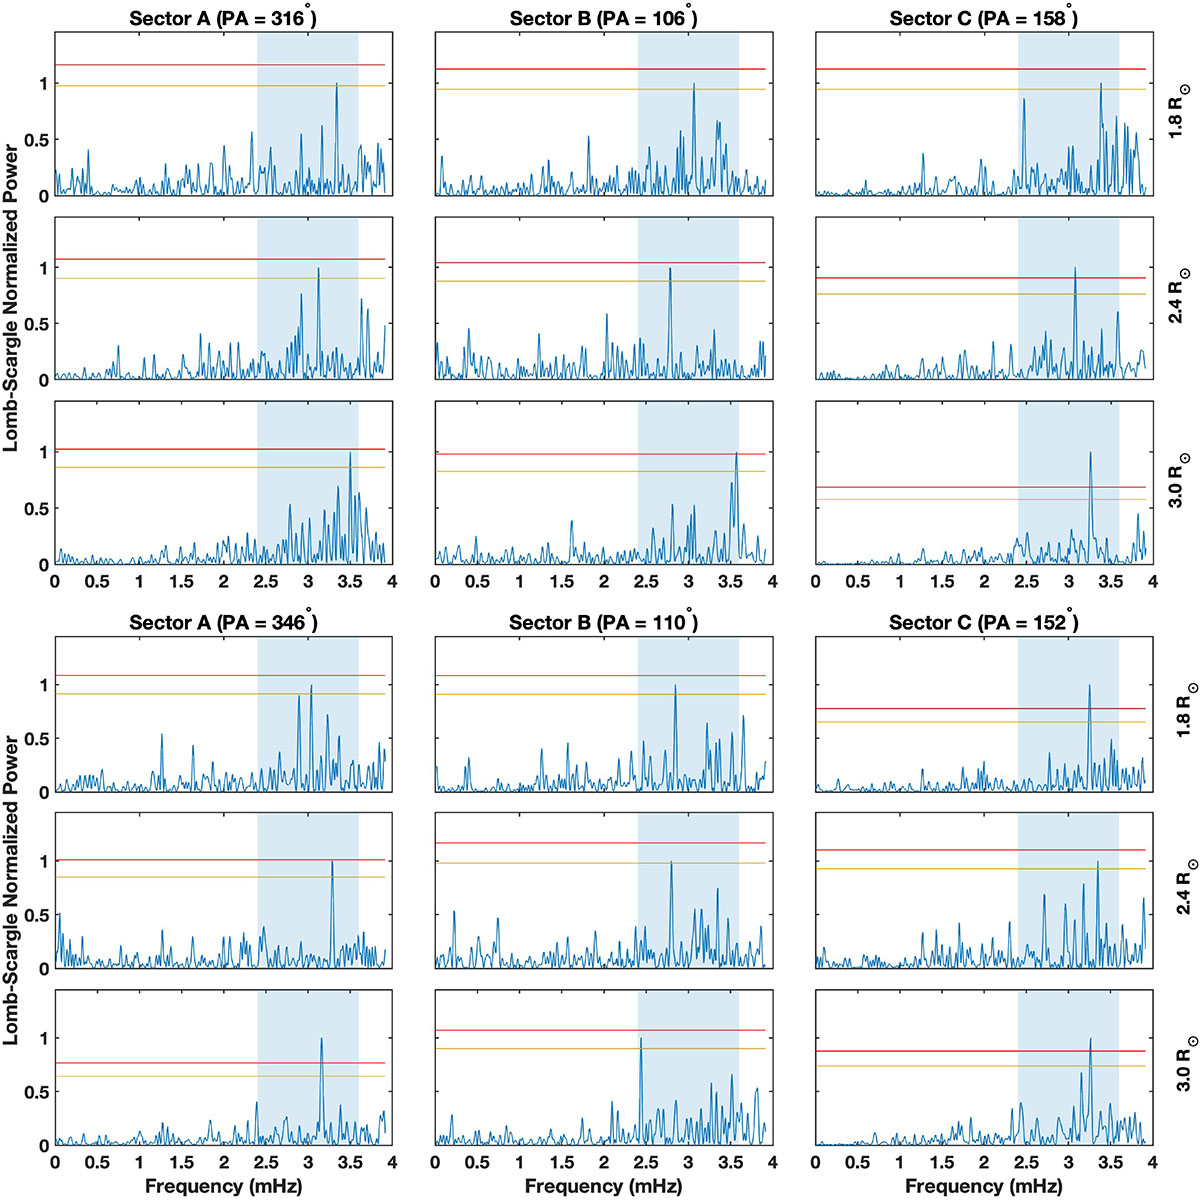
Lomb-Scargle periodograms, each of them normalized to its maximum power, for sectors A (left panels), B (middle panels), and C (right panels) for the same radial directions as considered in Fig. 6. The sector labels are reported at the top of each corresponding panel, as well as the radial direction, expressed in polar angle (PA) value. The corresponding heliocentric distances of the periodograms (1.8, 2.4, and 3.0 R⊙) are shown at the right side of each panel. The horizontal lines report confidence levels of 95% (in yellow) and 99% (in red). The light blue shaded area in each panel highlights the frequency band 2.4–3.6 mHz, where a strong concentration of power, higher than at least the 95% confidence level, is persistently present at different frequencies.
Current usage metrics show cumulative count of Article Views (full-text article views including HTML views, PDF and ePub downloads, according to the available data) and Abstracts Views on Vision4Press platform.
Data correspond to usage on the plateform after 2015. The current usage metrics is available 48-96 hours after online publication and is updated daily on week days.
Initial download of the metrics may take a while.