


Fig. 10.
Download original image
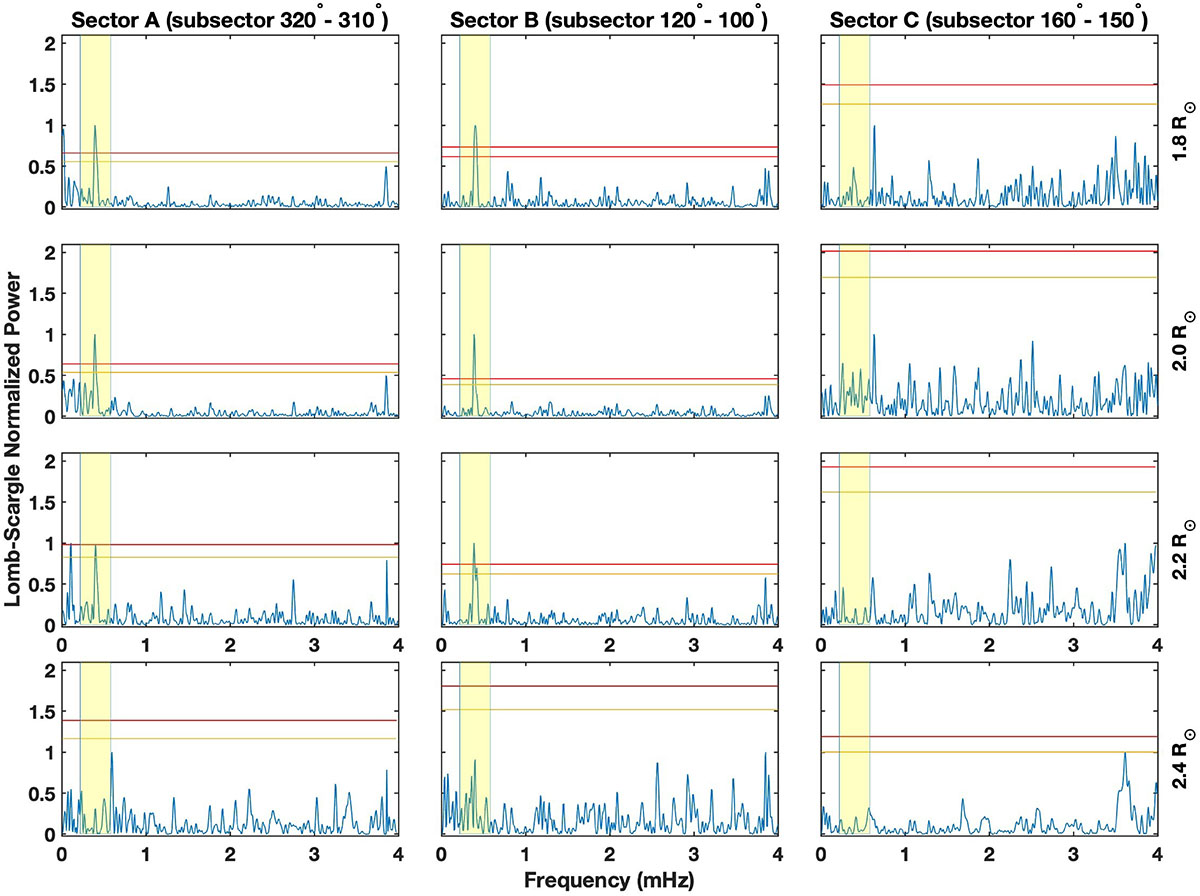
Lomb-Scargle periodograms, each of them normalized to its maximum power, for subsectors of sector A (left panels), B (middle panels), and C (right panels) after the filtering-out of the instrumental periodicity of 13 min, computed at radial distances of 1.8, 2.0, 2.2, and 2.4 R⊙ as reported at the right side of each panel. The peaks at 42 min are highlighted by a light yellow shaded area. The 95% and 99% confidence levels are reported as solid yellow and red lines, respectively.
Current usage metrics show cumulative count of Article Views (full-text article views including HTML views, PDF and ePub downloads, according to the available data) and Abstracts Views on Vision4Press platform.
Data correspond to usage on the plateform after 2015. The current usage metrics is available 48-96 hours after online publication and is updated daily on week days.
Initial download of the metrics may take a while.