


| Issue |
A&A
Volume 711, July 2026
|
|
|---|---|---|
| Article Number | A212 | |
| Number of page(s) | 11 | |
| Section | Extragalactic astronomy | |
| DOI | https://doi.org/10.1051/0004-6361/202557907 | |
| Published online | 16 July 2026 | |
The first near-infrared, high-resolution échelle spectroscopy of the outflow in NGC 4151
A study of the clouds covering the Eye of Sauron
1
INAF – Osservatorio Astronomico di Roma, Via Frascati 33, I-00078 Monte Porzio Catone (RM), Italy
2
Center for Astrophysics | Harvard & Smithsonian, 60 Garden Street, Cambridge, MA 02138, USA
3
Centre for Extragalactic Astronomy, Department of Physics, Durham University, South Road, Durham DH1 3LE, UK
4
ASI – Space Science Data Center, Via del Politecnico snc, I-00133 Roma, Italy
5
Dip. di Matematica e Fisica, Università degli Studi “Roma Tre”, Via della Vasca Navale 84, I-00146 Roma, Italy
★ Corresponding author: This email address is being protected from spambots. You need JavaScript enabled to view it.
Received:
30
October
2025
Accepted:
24
May
2026
Abstract
We present the first high-resolution near-infrared spectroscopy of the nucleus of the nearby, well-known Seyfert galaxy NGC 4151 (the ‘Eye of Sauron’). Past studies of this source have revealed that it exhibits a variable absorption feature associated with the He Iλ10 830 Å emission line, that is potentially indicative of obscuration events affecting the central engine. Here, we took advantage of the IRTF/iSHELL and TNG/GIANO-B spectrographs to observe this feature with unprecedented spectral resolution (λ/Δλ > 50 000); these allowed us to study the structure of the absorption trough and its variations in detail over a time span of ∼700 days. In order to infer a connection between the He I absorption variability and that of the X-ray ionising continuum, we also analysed the publicly available data collected by the Swift-XRT instrument over the same period of time, unveiling a potential driving mechanism in the changes of the outflow ionisation state due to the X-ray flux variations. We also derive outflow physical parameters – Ṁout ≲ 10−1 M⊙ yr−1, rout ∼ 3 pc, vmax ∼ 1000 km s−1 – that are in line with those of comparable ionised winds found in similar targets, where the outflow is not powerful enough to trigger a significant feedback from the active galactic nucleus (Ėkin/Lbol ∼ 0.001%). Such findings point at a scenario in which a dusty and clumpy outflow that obscures NGC 4151 up to galactic scales responds to changes in the ionising X-ray flux; this is similar to what happens in quasars with broad absorption lines and Seyferts with multi-phase outflows such as NGC 5548.
Key words: galaxies: active / galaxies: individual: NGC 4151 / galaxies: nuclei / galaxies: Seyfert / infrared: galaxies
© The Authors 2026
 Open Access article, published by EDP Sciences, under the terms of the Creative Commons Attribution License (https://creativecommons.org/licenses/by/4.0), which permits unrestricted use, distribution, and reproduction in any medium, provided the original work is properly cited.
This article is published in open access under the Subscribe to Open model. This email address is being protected from spambots. You need JavaScript enabled to view it. to support open access publication.
1. Introduction
Active galactic nuclei (AGN) are energetic processes located at the centres of galaxies (Lynden-Bell 1969), and powered by material accreting onto a supermassive black hole (SMBH; e.g. Shakura & Sunyaev 1973). AGN outflows limit the rate of SMBH growth and can significantly influence star formation in their host galaxy by depositing their kinetic energy in the surrounding environment (Springel et al. 2005; Martín-Navarro et al. 2018). The outflowing material, if directly located along our line of sight to the AGN, appears as blueshifted absorption lines offset from the rest-frame wavelength by velocities sometimes exceeding 10% of the speed of light. Such absorption features have been observed at several wavelengths, especially as broad absorption lines (BALs; e.g. Lynds 1967; Weymann et al. 1991) in near-IR (NIR), optical and UV, and as ultra-fast outflows (UFOs; e.g. Tombesi et al. 2010; Vietri et al. 2022) in the X-rays.
The outflowing gas is often found in various ionisation states, implying a corresponding variety of physical phases and ionising environments (e.g. Cicone et al. 2018); in particular, high-column-density outflows are predicted in AGN that provide the highest kinetic energies, thus making such sources invaluable test beds for galaxy-evolution models (see e.g. Hamann et al. 2019, and refs. therein). Atomic helium He I in the 23S state is metastable, and, due to its relatively low abundance making it less prone to saturation, can thus be used to study high-column-density outflows. In AGN outflows, metastable He I is almost entirely formed from He II recombination. The transitions of metastable He I form an emission triplet at wavelengths 3189 Å (UV), 3890 Å (optical) and 1.08 μm (NIR), the NIR component being the strongest. The effectiveness of using metastable He I as a means to understanding AGN outflows was first demonstrated by Leighly et al. (2011). By analysing the He I properties in the FBQS J1151+3822 quasar, they put significant constraints on the location of the absorber based on the ionisation parameter; on the number and column densities, NHeI; and on the spatial extension of the outflow, i.e. the covering fraction. However, to date, no high-resolution near-IR spectroscopy exists on any AGN known to harbour He I absorbers.
At variance with UV and X-ray wavelengths, where studies of outflows at high spectral resolution are common (e.g. Ellison et al. 1999; Kaspi & Behar 2006; Arav et al. 2008, 2020; Chen et al. 2021), only a few AGN are known to exhibit He Iλ10,830 absorbers (Leighly et al. 2011, 2014; Ji et al. 2015; Wildy et al. 2016; Liu et al. 2016; Zhang et al. 2017; Landt et al. 2019; Wildy et al. 2021; Liu et al. 2021; Mao et al. 2022) due to the need for them to form in environments that permit the production of He II ions (Wildy et al. 2021), and almost all of them are weak (NHeI < 1015 cm−2; e.g. Leighly et al. 2011). In this framework, instruments such asthe Immersion Grating Échelle Spectrograph (iSHELL; Rayner et al. 2022) on the NASA Infrared Telescope Facility (IRTF, Hawai’i Islands, the USA) and GIANO-B on the Telescopio Nazionale Galileo (TNG, Canary Islands, Spain) provide a unique opportunity to study the NIR He I absorbers.
NGC 4151 (Mayall 1934) at z = 0.0033 – commonly known as the ‘Eye of Sauron’ due to its visual appearance – is the brightest and most nearby AGN exhibiting such a feature in its NIR spectrum, which has also been found to be variable (Wildy et al. 2016). To date, the only other science case of an AGN showing a variable He I absorber is NGC 5548, as recently discovered by Landt et al. (2019, see their Fig. 1). Moreover, Wildy et al. (2021) reported on the discovery of both He I broad and narrow absorption in NGC 5548, associating the former with the obscurer itself and the latter with known UV components of the so-called warm absorber (WA). For such reasons, we aim to study this feature with unprecedentedly high spectral resolution using iSHELL and GIANO-B data and determine the nature of the obscuring and/or absorbing matter in the nucleus of NGC 4151 for the first time.
The paper is organised as follows: in Sect. 2, we present the observations and the adopted data-reduction procedures; in Sect. 3, we describe the fitting procedures used to decompose the NGC 4151 NIR spectra; in Sect. 4, we outline the X-ray data-reduction procedure and correlate the NGC 4151 X-ray spectral parameters with those of its He I absorption; finally, we discuss our results in Sect. 5 and summarise our work in Sect. 6. Throughout the text, we adopt a Λ-CDM cosmology with H0 = 70 km s−1 Mpc−1, ΩM = 0.3, and ΩΛ = 0.7.
2. Observations and data reduction
The IRTF observations were performed in contiguous dates, on 2020 May 18/19 and 2021 January 31/February 1, respectively, in the framework of a monitoring campaign aimed at characterising the time evolution of the NGC 4151 absorption properties (PI: H. Landt). The acquisitions were composed of pairs containing both a high-resolution iSHELL spectrum in échelle mode with the J0 setting to cover the He I spectral interval λλ1.062–1.165 μm in the observer frame with a resolving power of λ/Δλ ∼ 75 000, and a medium-resolution one (λ/Δλ ∼ 2000) taken with the SpeX spectrograph (Rayner et al. 2003) over the λλ0.7–2.5 μm range for a precise broadband modelling of the NGC 4151 NIR continuum emission. The GIANO-B échelle spectrum was taken on 2022 May 20 (PI: R. Middei) with the goal of detecting the He Iλ10 830 feature in the λλ1.065–1.105 μm spectral interval (38th and 39th échelle orders) at λ/Δλ ∼ 50 000; for the same purpose of broadband continuum modelling, also a low-resolution spectrum taken with the Near Infrared Camera Spectrometer (NICS; Baffa et al. 2001) was acquired on 2022 June 15 with the IJ grism (λλ0.85–1.45 μm spectral range, λ/Δλ ∼ 500). In Table 1, we report the relevant information concerning each observation.
Journal of observations. The signal-to-noise (S/N) ratios of each resulting spectrum were computed according to the prescriptions listed in Rosales-Ortega et al. (2012).
Each IRTF spectrum was reduced using the appropriate pipelines, namely Spextool v4.1 (Cushing et al. 2004) for SpeX and v5 for iSHELL. Similarly, the NICS observation has been reduced through standard IRAF (Tody 1986) and MIDAS routines (Warmels 1992). The GIANO-B exposure was initially reduced with the online data-reduction software (DRS; Harutyunyan et al. 2018); however, this resulted in an incorrect reconstruction of the He I emission profile; for this profile, the broad component was disappearing due to the interpolation and extraction procedure of the échelle orders. To overcome this issue, we first visually compared the wavelength ranges of the GIANO-B échelle orders with the iSHELL spectra. We thus checked that the He I feature did not extend beyond the 38th and 39th orders. Therefore, we decided to perform the last steps of the GIANO-B data reduction with a custom Python routine that allowed us to correctly extract the He I spectral region through the interpolation of the immediately adjacent orders, in which the residual signal of the He I is negligible. We present the final high-resolution spectra in Fig. 1: a visual inspection already reveals a certain degree of variability in both shape and flux level of the He I absorption.
 |
Fig. 1. NGC 4151 high-resolution spectra around the He Iλ10 830 Å emission feature in the observer frame. In each panel, the instrument and epoch of acquisition is indicated (see legends), along with both the zero-flux level (dotted lines) and the position of the He I transition in the observer frame (dashed line). The different flux levels are due to the lack of an inter-calibration among the spectra. |
3. Spectral decomposition and analysis
The effect of differential light absorption by an intervening medium with an optical depth of τλ on a spectrum composed by a continuum (Cλ) and a system of emission-line components (Lλ) can be mathematically written as (e.g. Hamann & Ferland 1999; Trevese et al. 2013)
 (1)
(1)
where fC and fL are the outflow covering factors of the continuum- and line-emission regions, respectively. Since our spectral section of interest is dominated by the emission from regions that are likely more spatially extended than the wind – namely, the broad-line region (BLR), the narrow-line region (NLR), and a dusty torus surrounding the central engine (Wildy et al. 2016) – we expect that both fC and fL are ≲1 (Trevese et al. 2013). However, disentangling the relative fractions of coverage on these various emitting regions is nontrivial for the case of NGC 4151, since the He I trough insists on all the emission components (see Fig. 1). Therefore, in the following we assumed fC = fL = 1 for simplicity; such an approach is commonly adopted in the literature (e.g. Capellupo et al. 2011), its major effect being an increment of the order of unity of the measured absorption intensities1 (see Trevese et al. 2013, and refs. therein).
3.1. The continuum fit
We first modelled the NGC 4151 continuum emission with an empirical combination of emission components, exploiting the line-free intervals of the low-resolution spectra. According to Wildy et al. (2016), the continuum spectrum can be fitted with a combination of host-galaxy stellar emission, power-law (PL) emission from the AGN accretion disc, and black-body (BB) emission from the torus. The host contribution was derived by combining the Sa- and Sb-type emission templates from the SWIRE library of galaxy spectral energy distributions2 (SEDs; Polletta et al. 2007). We noted that the 2020 and 2021 epochs were acquired with a narrower slit (0″.3) with respect to the epochs analysed in Wildy et al. (2016, 0″.8); this makes the host-galaxy contribution negligible, thus causing the fitting procedure to zero out its flux normalisation. To overcome this issue, for these two epochs we fixed the host-galaxy contribution to the average of the estimated fluxes derived from the HST observations analysed in Landt et al. (2011); such fluxes were adequately re-scaled to the different slit areas (0″.3 × 15″ and 1″ × 4″, respectively) used to acquire the SpeX and NICS spectra, with respect to the HST apertures (3″ × 4″.8 to 3″ × 8″.4).
In performing the continuum fit of the 2020 and 2021 epochs with the emission model by Wildy et al. (2016), we find that, at variance with their results, the continuum level in the wavelength range of 0.7–0.9 μm cannot be well reproduced unless a second BB component peaking at a shorter wavelength is added to the fit in both epochs to correctly model the observed flux level blueward of the Paϵ and Paδ transitions. According to an F-test, the inclusion of this additional component is statistically significant with respect to the single BB model for both epochs at 6.4σ and 7.6σ confidence levels, respectively.
Due to the more limited wavelength extension of the NICS spectrum (0.85–1.35 μm) with respect to the SpeX ones (0.7–2.55 μm), the fit with two BB components cannot be constrained in the 2022 epoch. Therefore, we only report the temperatures of the BB emitters derived for the double-BB best-fit model in Table 2 for the 2020 and 2021 epochs, along with the PL slopes of the AGN continuum. On average, the adopted empirical BB emissions have  K and
K and  K, respectively; such values are broadly consistent with the highest temperatures found by Lyu & Rieke (2021) in the modelling of the NGC 4151 SED with AGN emission components from warm dust (see their Figure 18). The best-fit continuum models of the NGC 4151 low-resolution spectra at each epoch are shown in Fig. 2; in what is described in the following, we only used this model to subtract the underlying continuum emission from the high-resolution IRTF/iShell and TNG/GIANO-B He I spectra.
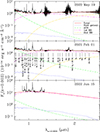 |
Fig. 2. Top panel: rest frame NGC 4151 low-resolution spectrum taken with IRTF/SpeX on 2020 May 19. Middle panel: spectrum taken with IRTF/SpeX on 2021 February 1. Bottom panel: spectrum taken with TNG/NICS on 2022 June 15. In all panels, the best fit to the continuum emission (solid red line) is shown superimposed to the data (solid black line) along with the host-galaxy template spectrum (dotted blue line), the AGN power law (short-dashed green line) and the two BB components (long-short-dashed magenta line and dot-dashed yellow line). The major IR emission lines (Landt et al. 2008) are labelled. As per the high-resolution spectra, the different flux levels are due to the lack of an inter-calibration procedure. |
Best-fit parameters of the NGC 4151 NIR spectral features.
3.2. The emission-line fit
In all epochs, the He Iλ10 830 Å emission line shows an absorption complex located blue-ward of the systemic peak wavelength that can be interpreted as due to an outflow with moderate velocity. In order to evaluate the physical parameters of this absorber, we performed an empirical spectral decomposition of the He I+Paγ blend based on multiple Gaussian emission components, with at least two of them – a broad (FWHM ≳ 2000 km s−1) and a narrow one (FWHM ≲ 500 km s−1) – for every allowed transition. Such a model is similar to that performed by Wildy et al. (2016) on a 2015 spectrum of NGC 4151, which is free of major absorption features; at variance with them, we also included a narrow Fe II contribution located at λ ∼ 1.085 μm (Landt et al. 2008). First, we fitted the [S III] λ9531 emission line on the low-resolution SpeX and NICS spectra to infer the full width at half maximum (FWHM) of the narrow emission components. To this aim, we subtracted the continuum emission shown in Fig. 2 from the corresponding data; then, we modelled the line profile with a single Gaussian that is left completely free to vary in each epoch. Finally, we computed the intrinsic FWHM of the narrow-line emissions by removing the systematic width increase due to the spectral resolution Δvsys.
 (2)
(2)
For all spectra, we obtained compatible results within 1σ uncertainties. Therefore, we adopted FWHMint = 220 ± 20 km s−1 as the common value for the width of narrow emission components in the He I+Paγ complex.
After this step, we applied the empirical model to the absorption-free intervals of the He I+Paγ spectral region observed with iSHELL and GIANO-B. In these fits, the 1.08 μm ≲ λ ≲ 1.083 μm region was excluded (see Fig. 4) due to the presence of the absorption feature, whereas the FWHM of the narrow components is fixed to the value found from the [S III] fit performed on the low-resolution spectra3 The level of the continuum emission was derived by rescaling the result of the low-resolution spectral modeling by a constant factor, which was set free to vary in each epoch. In performing the fitting procedure, we noted that the full emission profile could not be precisely recovered unless we included a further intermediate-velocity Gaussian component with FWHM ∼ 1000 km s−1 at all epochs. After having obtained best-fit models for all the three epochs separately, we re-scaled all spectra and models to the integrated flux of the recovered narrow He I emission of the 2020 epoch. The resulting best fits are shown in Fig. 3; the FWHMs of both broad and intermediate components are reported in Table 2. The discrepancy at > 95% confidence level that insists on the 2022 BLR and intermediate FWHMs with respect to the values obtained for the previous epochs can be ascribed to the custom GIANO-B data reduction performed to recover the broad He I emission profile (see Sect. 2).
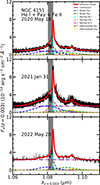 |
Fig. 3. Rest-frame best-fit profiles of the He I+Paγ blended emission around 1.08 μm. Top panel: 2020 May 18 epoch. Middle panel: 2021 January 31 epoch. Bottom panel: 2022 May 20 epoch. In all panels, the total unabsorbed emission profile (solid red line) is shown superimposed to the data (solid black line), along with the continuum flux level (dot-dashed purple line) and the emission components adopted for the line decomposition (dashed lines). In addition, both the zero-flux level (dotted black line) and the masked region (grey band) are indicated. |
3.3. Decomposition of the He I absorption
After having normalised the observed fluxes to the respective best fits for both epochs, we proceeded to modelling the He I absorption feature of NGC 4151. To this end, owing to Eq. (1), we assumed that the absorbed flux in the velocity space, F(v), could be described as (e.g. Hamann & Ferland 1999):
 (3)
(3)
where F0(v) is the unabsorbed flux and τv is the optical depth of the absorption. At a first order, we approximated τv with a sum of Gaussian profiles:
![Mathematical equation: $$ \begin{aligned} \tau _v = \sum _{i = 1}^{N} \tau _v^{(i)} = \sum _{i = 1}^{N} A_i \times \exp {\left[ -\frac{\left( v - \Delta v_i \right)^2}{2 \sigma _i^2} \right]}, \end{aligned} $$](/articles/aa/full_html/2026/07/aa57907-25/aa57907-25-eq12.gif) (4)
(4)
with Ai, Δvi, and σi the absorption strength, velocity shift, and velocity dispersion of each feature, respectively. Such quantities are connected to the corresponding equivalent widths, EWi, by
![Mathematical equation: $$ \begin{aligned} \mathrm{EW}_i = \int _{-\infty }^{+\infty } \left[ 1 - e^{-\tau _v^{(i)}} \right] dv. \end{aligned} $$](/articles/aa/full_html/2026/07/aa57907-25/aa57907-25-eq13.gif) (5)
(5)
We then performed the fit of the He I absorbed spectral region by progressively including additional profiles, until a good agreement with the data was reached by the means of both visual inspection and statistical significance. The best fit was obtained for N = 3, i.e. decomposing the total absorption into three components at distinct velocities. In doing this, we found that the best-fit parameters – EWs, velocity shifts, FWHMs – in the 2020 and 2021 epochs were compatible for each component within the respective 2σ errors: this points at a substantial stability of the outflow structure and dynamics over those epochs. Therefore, we described the He I absorption in these two epochs by computing the uncertainty-weighted averages of such parameters. In contrast, a visual inspection of the He I absorption in the 2022 epoch revealed a radically different trough shape with respect to the previous epochs: for this reason, we studied this epoch separately from the other two. In addition, the fit to the 2022 He I broad absorption required us to mask two further narrow components that appeared at |Δv|≲200 km s−1, the study of which is postponed to future work. We report the values of EW, blueshift, and FWHM obtained in this way in Table 2; in Fig. 4, we show the resulting modelling of the He I absorption system.
Finally, we computed the outflow column density,  , associated with each absorption component by integrating the corresponding optical depth in the velocity space (Savage & Sembach 1991; Wildy et al. 2016):
 (6)
(6)
 |
Fig. 4. Top panel: spectral decomposition of the He I absorption at high resolution in the 2020 epoch. Middle panel: same as for the 2021 epoch. Bottom panel: same as for the 2022 epoch. In the bottom panel, the masks applied to the narrow absorption features mounted on top of the broad He I trough (grey bands) are shown. In all panels, both the emission level normalised to the pseudo-continuum model and the zero-velocity position (dashed black lines) are indicated, and the total absorption model (dashed red line) is plotted along with the single absorption components (dot-dashed lines). |
with me being the electron mass, c the speed of light, f the He I oscillator strength (Weiss 1967), λ0 the laboratory rest-frame wavelength, and q the elementary charge. Taking f = 0.6257 for the total 23S transitions of the He I (Spitzer 1998), we calculated  for each absorber at all epochs. For the highest velocity component, the associated column density was compatible with zero in both epochs after having propagated the best-fit parameter uncertainties in Eq. (6). Since all of the
  were compatible within the respective 1σ uncertainties between the 2020 and 2021 epochs, we took the weighted averages over these two epochs for them too (see Table 2). Overall, a decreasing trend in the total absorber density was present between 2020–2021 and 2022, where both the shape and the physical parameters of the He I absorption underwent relevant changes (see Fig. 4). The most striking feature among these variations is the increase in absorption strength and velocity of the fastest component, which points at changes in the outflow structure.
To quantify these effects, we studied, for each component, the time evolution of the absorption parameters: 23S He I column densities; absolute values of the velocity blueshifts |Δv|; and FWHMs. For each parameter, we constructed the time variability curve between 2020 and 2022; the results are reported in Fig. 5. A general slowdown of all the absorption components by a factor of ∼2 at a > 99% confidence level was accompanying the reversal in both NHeI and FWHM of the high-velocity component with respect to the lower velocity ones. Changes in the He I absorption structure were already detected by Wildy et al. (2016, see their Figure 8), with blueshifts spanning from ∼100 km s−1 in their Epoch 2 to ∼800 km s−1 in their Epoch 3, i.e. over a time interval of ∼2 yr; furthermore, the bulk outflow velocity monotonically decreases down to ∼400 km s−1 over their following two epochs. We highlight that such a decomposition of the He I absorption profile was purely empirical, and is adopted with the main purpose of studying the trough properties and variability through a smooth line profile that is free of noise or intervening spurious components (see Fig. 5), thus allowing for an analytic calculation of the associated physical quantities. In the following, we thus only discuss the global absorption properties rather than further distinguishing among individual components of the He I trough.
 |
Fig. 5. Time variability of the NGC 4151 He Iλ10 830 absorption parameters. Left panel: column density of neutral helium atoms in the 23S state. Middle panel: velocity blueshifts. Right panel: FWHMs of each absorption component. In all panels, the three components of the He I absorption system are identified by the same colours and symbols (see legend). |
4. Swift X-ray data
It is presently known that quasars with gas outflows often exhibit multiple absorption troughs in several bands (e.g. Cicone et al. 2018); such multi-phase outflows are ubiquitous across the cosmic time, being found from the epoch of the local Universe (e.g. Mrk 231 at z ∼ 0.04; Feruglio et al. 2010) to those much earlier than the quasar activity peak at z ∼ 2 (e.g. SDSS J153830.55+085517.0 at z ∼ 3.6; Vietri et al. 2022), and they can consistently vary together in response to changes in the structure and/or physical properties of the absorbing gas (e.g. Cicone et al. 2018). NGC 4151 is known to show absorption in other bands, such as in the X-ray band (Beuchert et al. 2017; Gianolli et al. 2023), where it has been subject to extensive observing campaigns with, for example, the X-Ray Telescope (XRT) on board the Swift satellite (Swift-XRT; Burrows et al. 2000). We therefore performed the analysis of the complete public Swift-XRT dataset of NGC 4151 in search of indications of common variability properties between the He I absorption, the X-ray absorber, and the X-ray ionising flux.
To seek a connection between the X-ray and IR data of NGC 4151, we collected all the available Swift-XRT observations available between April 2019 and December 2023, for a total of 165 epochs. The high-level science products were obtained using the standard pipelines xrtpipeline and xrtproducts4. To extract the source spectrum and take into account any pile-up issues, we used an extracting region with a variable shape. A circle or an annulus, respectively, are adopted in the cases of a source rate < 0.6 s−1 or > 0.6 s−1. The inner radius of the region is determined on the basis of the observed count rate as per Table 2 of Middei et al. (2022). Regardless of its circular or annular shape, the source-extracting region always has an outer radius of 50″. For the background, we used an annulus centred on the source with a fixed gap of 25 pixels (∼60″) between the inner and outer radii. The obtained spectra were subsequently binned, requiring at least five counts per bin.
For each of the 165 observations, we fitted the corresponding spectrum with XSPEC (Arnaud 1996), adopting the following model:

The first component accounted for the Milky Way hydrogen column, NH, whereas the second one accounted for the local neutral absorption,  , commonly observed in NGC 4151. Then, zxipcf was used to reproduce the WAs while a PL emission is assumed for the primary continuum emission. In the fits, we kept the Milky Way NH = 2.1 × 1020 cm−2 fixed (HI4PI Collaboration 2016), while we left
  free to vary. For the WA matter we computed the column density, the ionisation level, and the covering fraction in each observation. Finally, only the normalisation of the primary continuum was fitted, fixing the PL photon index, Γ to a standard value of 1.8 (see e.g. Piconcelli et al. 2005; Bianchi et al. 2009; Matzeu et al. 2023) to mitigate the known degeneracy between the source spectral shape and the column density of the absorbers.
We present the main results of the X-ray data analysis – namely the soft photon flux,  ; the hardness ratio; and the X-ray neutral absorber’s column density,
  – in Fig. 6 as a function of the observing epoch. Since until MJD ∼58 200 the Swift-XRT coverage of NGC 4151 was sparse, we restricted our inspection to the most populated time range MJD = 58 200–60 200; this allowed us to directly compare the behaviour of the NGC 4151 X-ray properties with the He I absorbed epochs studied in this paper. A visual inspection of Fig. 6 revealed that, around MJD ∼59 200,
  exhibited a peak – with an increase in intensity by a factor of ∼7 – simultaneous to the two epochs with the most intense He I absorption; subsequently, when the
  strength had already decreased, a peak in
  (MJD ∼59 500) – with an increase by a factor of ∼40 – happened just before the observed decrease of the He I column density. These changes in the X-ray flux were consistent with the variations found in the NGC 4151 hardness ratio over the same time period. Though interesting, however, such temporal coincidences hinted at a potential correlation between the He I absorber status and the X-ray activity of NGC 4151 with a confidence level too marginal to allow us to reach firm conclusions.
 |
Fig. 6. Multi-epoch evolution of NGC 4151 X-ray parameters compared to the He I column density, along with the corresponding 1σ uncertainties. Top panel: soft X-ray flux |


5. Discussion
The He I absorption trough of NGC 4151 has clearly undergone a change in shape and intensity over a one-year timescale, with a general decreasing trend in both strength and velocity spread. This effect is well documented in the literature, especially in the case of AGN with BALs (BAL QSOs; Barlow 1993) for which both single-object (Barlow et al. 1992; Trevese et al. 2013) and ensemble studies (Lundgren et al. 2007; Gibson et al. 2008, 2010; Capellupo et al. 2011, 2012, 2013; Filiz Ak et al. 2013) have provided information on the time variability of such features on several scales (from ∼10−2 to ∼10 years). In some extreme cases, the appearance (e.g. Krongold et al. 2010; Vietri et al. 2022) or disappearance (e.g. Hall et al. 2011) of BALs in quasar spectra has been documented. In the following, we discuss the He I absorption variability in connection with the activity of the central engine and derive estimates of the physical properties of the parent outflow.
5.1. He I absorption variability
To investigate the driving mechanism of the He I absorption variability in NGC 4151, we constructed the temporal evolution of the NHeI(23S) parameter by joining the measurements performed by Wildy et al. (2016) with those presented in Table 2; we thus obtained a ‘dark curve’ of the NGC 4151 He I absorption extended over ∼20 years5. We show the absorption trend in Fig. 7; a visual inspection revealed He I obscured epochs alternated to unabsorbed periods. To quantify the significance of these variations in the He I column density over time, we performed a Cox regression test (Cox 1972) on the time series shown in Fig. 7. This method allowed us to take into account both data uncertainties and upper limits, similarly to other common-use statistical methods for analysing left-censored astronomical data (e.g. Feigelson & Nelson 1985; Isobe et al. 1986). Assuming a constant NHeI(23S) = (1.92 ± 0.62)×10−13 cm−2 – corresponding to the average of the significant He I column density values – over the MJD 52 200–60 000 time period as the null hypothesis, the test yielded an associated probability of 0.04, which implies a 96% (> 2σ) significance of the NHeI(23S) variability.
 |
Fig. 7. Evolution of He I column density over 20 years of IR spectroscopic observations of NGC 4151. Epochs before MJD = 58000 are taken from Wildy et al. (2016). Upper limits (black arrows) are computed at a 2σ confidence level. The average of the significant He I measurements (dot-dashed line), along with its 1σ uncertainty (dashed line), is indicated. |
The main driving mechanism of BAL variability is still a subject of debate: to date, there are in fact no decisive observations that may allow us to distinguish among the proposed scenarios to explain this phenomenon, which is commonly attributed to a combination of variable ionising flux and motion of gas into and out of the line of sight (e.g. Crenshaw et al. 2003). The only other object that is known to have a multi-phase outflow visible from the X-rays to the IR wavelengths is the nearby AGN NGC 5548 (e.g. Edelson et al. 1999; Kaastra et al. 2000). Wildy et al. (2021) discovered that this active galaxy is also hosting a He I absorption trough whose variations are directly influenced by changes in the soft X-ray flux that also trigger the variability of the WA component. In addition, they found that some of the NGC 5548 He I absorption components were connected to an obscuration event that happened in 2013. They were thus able to describe the inner structure of NGC 5548 with the accretion-disc wind model by Dehghanian et al. (2019a,b), in which the absorption variability is partly due to changes in the density of the obscurer and partly responding to X-ray flux variations.
Based on the hints provided by the analysis of the NGC 4151 X-ray data, it is plausible that the NGC 4151 He I absorption variability is partially connected with changes in the X-ray properties (see Sect. 4). In this scenario, periods of increasing X-ray flux result in decreasing absorption strengths due to the higher ionisation of atoms; conversely, low-emission states allow the outflowing gas to recombine, giving rise to stronger absorption features. Clearly, the evidence of the association between the NGC 4151 X-ray and absorption variability presented here is weak, and only tentatively based on visual inspections of time series coming from data analyses of IR and X-ray spectra. The application of quantitative methods to estimate the likelihood of such an association, such as the calculation of cross-correlation functions (e.g. Gaskell & Peterson 1987; Edelson & Krolik 1988; Alexander 1997) between the studied time series cannot be considered at the moment, given the paucity and temporal scatter of He I absorption measurements.
5.2. Physical properties of the parent outflow
Having derived the velocity and density properties of each He I absorption component described in Sect. 3 (see Table 2), we proceeded to use them to estimate some physical properties of the parent outflow. Measurements of quantities such as the outflowing mass rate, Ṁout; kinetic power, Ėkin; and momentum rate, Ṗout are traditionally performed on AGN exhibiting the presence of ionised winds detected in emission in their spectra (see e.g. Saturni et al. 2021, and refs. therein). However, in recent years similar calculations have also begun for outflows seen as absorption troughs in AGN and starburst galaxies (e.g. Xu et al. 2023; Dehghanian et al. 2025). To achieve a rough idea of the energy budget involved in the He I outflow of NGC 4151, we followed the approach of Dehghanian et al. (2025) by computing Ṁout as
 (7)
(7)
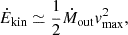
where vmax is the maximum outflow velocity, mp the proton mass, μ = 1.4 the average atomic mass per proton, NH the hydrogen column density, rout the outflow spatial extension, and fint the intrinsic covering fraction of the outflow. This quantity in turn allowed us to determine the outflow kinetic power, Ėkin, and momentum rate, ṗout, as (Saturni et al. 2021; Dehghanian et al. 2025)
 (8)
(8)
 (9)
(9)
Taking vmax = |Δv3|+2σ3 (Bischetti et al. 2017) as equal to 840 ± 140 km s−1 from our spectral analysis (see Table 2), with  , the only unknown quantities in Eq. (7) are NH, fint, and rout. The second is usually assumed to be equal to the overall detected fraction of BAL QSOs, which is found to be ≈0.2 at all cosmic times (e.g. Hewett & Foltz 2003; Gibson et al. 2009; Allen et al. 2011; Dai et al. 2012); we estimated the latter in the same way as Lamer et al. (2003, see their Eq. (3)):
 (10)
(10)
Here, M7 is the SMBH mass in units of 107 M⊙, L42 the ionising luminosity in units of 1042 erg s−1, tdays the variability timescale of the absorption expressed in days, N22 the hydrogen column density in units of 1022 cm−2, and U the ionisation parameter.
We estimated L42 over the range of unobserved ionising energies following the procedure detailed in Grier et al. (2015), calibrating the synthetic quasar SED of Dunn et al. (2010) to the NGC 4151 bolometric luminosity Lbol from its AGN activity. From the Swift-XRT X-ray data, we derived  erg s−1 cm−2 for the epochs free of major flares (see Fig. 6), corresponding to a soft X-ray luminosity
  erg s−1. We used this value to solve Equation (21) of Marconi et al. (2004) for Lbol:
![Mathematical equation: $$ \begin{aligned} \log {\left[ \frac{L_{\rm bol}}{L_{\rm X}^\mathrm{(s)}} \right]} = 1.65 + 0.22 \mathcal{L} + 0.012 \mathcal{L} ^2 - 0.0015 \mathcal{L} ^3, \end{aligned} $$](/articles/aa/full_html/2026/07/aa57907-25/aa57907-25-eq36.gif) (11)
(11)
where ℒ = log(Lbol/L⊙) − 12. In turn, we obtained Lbol ∼ 8.9 × 1041 erg s−1 and an ionising luminosity normalisation L911 of ∼5.5 × 1025 erg s−1 Hz−1 by adopting the bolometric correction at 911 Å of Richards et al. (2006, see their Figure 12). Integrating the synthetic SED over the range of ionising frequencies, we were thus able to estimate an NGC 4151 ionising luminosity Lion of ∼3.2 × 1041 erg s−1, corresponding to L42 ∼ 0.32.
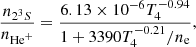
The outflow helium, hydrogen, and electron densities nHe+, nH, and ne ∼ 1.2nH ∼ 13.3nHe+ (Osterbrock & Ferland 2006; Dehghanian et al. 2025) for a typical plasma composed of ∼90% hydrogen and ∼9% helium and metals (Xu et al. 2023), can be related to the number density of helium atoms in the 23S state via Equation (4) of Ferland (1986):
 (12)
(12)
with T4 the plasma temperature normalised to 104 K. Replacing nHe+ with its relation to nH and inverting this equation for the latter, we find
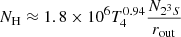 (13)
(13)
after having removed the negligible terms and having further assumed n ∼ N/rout for all densities. Adopting a typical Seyfert outflow temperature T of ∼14 000 K (e.g. Dehghanian et al. 2024) – i.e. T4 ∼ 1.4 and N23S = (0.9 ± 0.5)×1013 cm−2, computed by averaging the values reported in Table 2 – we solved Eq. (10) with the adoption of tdays = 601 ± 129 rest-frame days from the time difference between the GIANO-B and the IRTF observations (see Table 1); a mean U ∼ 0.04 (Alexander et al. 1999); and a SMBH mass MBH = (1.7 ± 0.4)×107 M⊙ (Bentz et al. 2022) for NGC 4151. We finally obtained  pc, corresponding to NH ≈ (1.1 ± 0.8)×1019 cm−2, i.e. N22 ≈ (1.1 ± 0.8)×10−3. Such a value is in agreement with the typical location at approximately parsec scales of AGN absorbers found in the literature for similar targets (see e.g. Tombesi et al. 2012, and refs. therein).
Through Eq. (7), we were then able to compute a value of  M⊙ yr−1. This in turn yielded
  erg s−1 and
  erg cm−1. We summarise our findings on the NGC 4151 He I outflow energetics in Table 3. Overall, the estimated quantities are in line with similar values found in Seyfert galaxies and quasars of comparable energetics exhibiting spectral outflows seen in both absorption (see Dehghanian et al. 2025, and refs. therein) and emission (see Saturni et al. 2021, and refs. therein). It is to be noted that the Ėkin reported in Table 3 is negligible (≪0.1%) if compared to the NGC 4151 Eddington luminosity LEdd ∼ 1.9 × 1045 erg s−1, as also found in similar sources (e.g. Blustin et al. 2005); given that a minimal ratio Ėkin/LEdd ≈0.5% is required for an outflow to significantly contribute to the AGN feedback (Hopkins & Elvis 2010), the ionised wind in NGC 4151 is too weak to have a considerable impact on the gas reservoir of the host galaxy, even when taking into account the systematic uncertainties insisting on the adopted equations that exert biases at the level of 1–2 dex (Bischetti et al. 2017; Saturni et al. 2021).
Summary of the relevant physical properties of the He I outflow detected in the NGC 4151 IR spectrum.
6. Summary and conclusions
In this paper, we presented a multi-wavelength study of the inner engine of the Seyfert galaxy NGC 4151, taking advantage of high-resolution NIR échelle spectroscopy carried out with the iSHELL and GIANO-B instruments mounted at the IRTF and TNG telescopes, respectively. The > 50 000 resolving power of these spectrographs has allowed a detailed decomposition over a three-year period of the absorbing trough associated with the He Iλ10 830 emission, that was already the subject of one of the few existing works on this topic (Wildy et al. 2016). To infer some connection of this absorption feature with the AGN ionising flux, we also performed the analysis of the NGC 4151 X-ray emission over the same time span, taking advantage of the public Swift-XRT data. We summarise our main findings as follows:
-
The He I absorption system could be empirically decomposed into three components, that highlighted the variation of the trough structure over time – velocity shifts decreasing by a factor of ∼2 in ∼450 days from MJD ∼59 250 to MJD ∼59 700 (see Fig. 5) – accompanied by changes in the overall absorption profile. This decomposition allowed the measurement of outflow velocities up to ∼800 km s−1 and total column densities of ∼1013 cm−2; in all epochs, such values were lower than the column densities found by Wildy et al. (2016) for the total absorption (≲3 × 1013 cm−2) during the NGC 4151 obscured epochs around MJD ∼55 000.
-
The investigation of the NGC 4151 X-ray emission revealed that the highest intensity of the He I absorption was coincident with an increase by a factor of ∼4 in the column density of the X-ray-neutral absorber (see Fig. 6); similarly, the decrease in NHeI happened after an increase by a factor of ∼20 in the X-ray flux, lasting approximately the duration of the time gap between the second IRTF/iSHELL observation and the TNG/GIANO-B epoch.
-
The parent outflow that is the origin of the He I absorption trough exhibits properties typical of similar processes at work in AGN (see Table 3; e.g. Blustin et al. 2005; Tombesi et al. 2012), although it is not powerful enough to efficiently trigger a global AGN feedback (Ėkin/LEdd ≪ 0.1%; Hopkins & Elvis 2010).
These findings suggest a scenario in which – similarly to what happens in BAL QSOs (e.g. Trevese et al. 2013; Saturni et al. 2016) and in NGC 5548 (Wildy et al. 2021) – both (part of) the X-ray absorption and the He I feature are produced by the same clumpy outflow, whose physical properties change either through modifications in the outflow structure or by responding to variations of the X-ray flux. The future investigation of the rare He I absorption with high-resolution near-IR instruments, also in connection with multi-wavelength observations in other energy bands (e.g. UV/optical, X-rays), will be of extreme interest to infer the properties of the less common cold obscurers with respect to the more ubiquitous ionised outflows; in this framework, more detailed studies of the mechanisms acting behind the NGC 4151 outflows in connection with the AGN activity – for example by modelling the outflow physics with the CLOUDY photo-ionisation code (Ferland et al. 1998) – are also needed, as well as a denser monitoring of the NGC 4151 central engine in a multi-wavelength framework to allow us to establish more quantitative correlations among the several observable features (AGN ionising flux, absorption strength, outflow velocity) with rigorous techniques for time-series analysis (e.g. Gaskell & Peterson 1987; Edelson & Krolik 1988; Alexander 1997).
Acknowledgments
We acknowledge Dr. Ennio Poretti (INAF-OAB) for the award of INAF-TNG DDT observing time for NGC 4151 with GIANO-B. We thank Prof. Martin J. Ward (University of Durham) for his help with the scientific interpretation of the analysed data, Dr. Avet Harutyunyan (INAF-TNG) and Dr. Simone Antoniucci (INAF-OAR) for their assistance with the observation preparation and data reduction. We also thank the anonymous referee for their helpful comments. RM acknowledges financial support from the INAF Scientific Directorate. HL acknowledges a Daphne Jackson Fellowship sponsored by the Science and Technology Facilities Council (STFC), UK, and support from STFC grants ST/P000541/1, ST/T000244/1 and ST/X001075/1. HL was the astronomer observing with the Infrared Telescope Facility (IRTF), which is operated by the University of Hawaii under contract 80HQTR24DA010 with the National Aeronautics and Space Administration (NASA). Based on observations made with the Italian Telescopio Nazionale Galileo (TNG), operated on the island of La Palma by the Fundación Galileo Galilei of the INAF (Istituto Nazionale di Astrofisica) at the Spanish Observatorio del Roque de los Muchachos of the Instituto de Astrofísica de Canarias. The processed data underlying this work are available on request from the authors. The IRTF raw data are publicly available at the NASA IRTF Archive hosted by the NASA/IPAC Infrared Science Archive (https://irsa.ipac.caltech.edu). The Swift data are available to the scientific community through data centres in the USA, Italy, and the UK.
References
- Alexander, T. 1997, Astrophys. Space Sci. Lib., 218, 163 [Google Scholar]
- Alexander, T., Sturm, E., Lutz, D., et al. 1999, ApJ, 512, 204 [NASA ADS] [CrossRef] [Google Scholar]
- Allen, J. T., Hewett, P. C., Maddox, N., Richards, G. T., & Belokurov, V. 2011, MNRAS, 410, 860 [NASA ADS] [CrossRef] [Google Scholar]
- Arav, N., Kaastra, J., Kriss, G. A., et al. 2005, ApJ, 620, 665 [CrossRef] [Google Scholar]
- Arav, N., Moe, M., Costantini, E., et al. 2008, ApJ, 681, 954 [NASA ADS] [CrossRef] [Google Scholar]
- Arav, N., Xu, X., Miller, T., Kriss, G. A., & Plesha, R. 2020, ApJS, 247, 37 [Google Scholar]
- Arnaud, K. A. 1996, ASP Conf. Ser., 101, 17 [Google Scholar]
- Baffa, C., Comoretto, G., Gennari, S., et al. 2001, A&A, 378, 722 [NASA ADS] [CrossRef] [EDP Sciences] [Google Scholar]
- Barlow, T. A. 1993, Ph.D. Thesis, University of California System [Google Scholar]
- Barlow, T. A., Junkkarinen, V. T., Burbidge, E. M., et al. 1992, ApJ, 397, 81 [NASA ADS] [CrossRef] [Google Scholar]
- Bentz, M. C., Williams, P. R., & Treu, T. 2022, ApJ, 934, 168 [CrossRef] [Google Scholar]
- Beuchert, T., Markowitz, A. G., Dauser, T., et al. 2017, A&A, 603, A50 [NASA ADS] [CrossRef] [EDP Sciences] [Google Scholar]
- Bianchi, S., Guainazzi, M., Matt, G., Fonseca Bonilla, N., & Ponti, G. 2009, A&A, 495, 421 [NASA ADS] [CrossRef] [EDP Sciences] [Google Scholar]
- Bischetti, M., Piconcelli, E., Vietri, G., et al. 2017, A&A, 598, A122 [NASA ADS] [CrossRef] [EDP Sciences] [Google Scholar]
- Blustin, A. J., Page, M. J., Fuerst, S. V., Branduardi-Raymont, G., & Ashton, C. E. 2005, A&A, 431, 111 [CrossRef] [EDP Sciences] [Google Scholar]
- Burrows, D. N., Hill, J. E., Nousek, J. A., et al. 2000, SPIE Conf. Ser., 4140, 64 [Google Scholar]
- Capellupo, D. M., Hamann, F., Shields, J. C., Rodríguez Hidalgo, P., & Barlow, T. A. 2011, MNRAS, 413, 908 [NASA ADS] [CrossRef] [Google Scholar]
- Capellupo, D. M., Hamann, F., Shields, J. C., Rodríguez Hidalgo, P., & Barlow, T. A. 2012, MNRAS, 422, 3249 [CrossRef] [Google Scholar]
- Capellupo, D. M., Hamann, F., Shields, J. C., Halpern, J. P., & Barlow, T. A. 2013, MNRAS, 429, 1872 [CrossRef] [Google Scholar]
- Chen, C., Hamann, F., Ma, B., & Murphy, M. 2021, ApJ, 907, 84 [NASA ADS] [CrossRef] [Google Scholar]
- Cicone, C., Brusa, M., Ramos Almeida, C., et al. 2018, Nat. Astron., 2, 176 [Google Scholar]
- Cox, D. R. 1972, J. Royal Stat. Soc.: Ser. B (Methodological), 34, 187 [Google Scholar]
- Crenshaw, D. M., Kraemer, S. B., & George, I. M. 2003, ARA&A, 41, 117 [NASA ADS] [CrossRef] [Google Scholar]
- Cushing, M. C., Vacca, W. D., & Rayner, J. T. 2004, PASP, 116, 362 [NASA ADS] [CrossRef] [Google Scholar]
- Dai, X., Shankar, F., & Sivakoff, G. R. 2012, ApJ, 757, 180 [NASA ADS] [CrossRef] [Google Scholar]
- Dehghanian, M., Ferland, G. J., Kriss, G. A., et al. 2019a, ApJ, 877, 119 [NASA ADS] [CrossRef] [Google Scholar]
- Dehghanian, M., Ferland, G. J., Peterson, B. M., et al. 2019b, ApJ, 882, L30 [NASA ADS] [CrossRef] [Google Scholar]
- Dehghanian, M., Arav, N., Byun, D., Walker, G., & Sharma, M. 2024, MNRAS, 527, 7825 [Google Scholar]
- Dehghanian, M., Arav, N., Sharma, M., et al. 2025, A&A, 695, A4 [NASA ADS] [CrossRef] [EDP Sciences] [Google Scholar]
- Dunn, J. P., Bautista, M., Arav, N., et al. 2010, ApJ, 709, 611 [NASA ADS] [CrossRef] [Google Scholar]
- Edelson, R. A., & Krolik, J. H. 1988, ApJ, 333, 646 [Google Scholar]
- Edelson, R., Vaughan, S., Warwick, R., Puchnarewicz, E., & George, I. 1999, MNRAS, 307, 91 [Google Scholar]
- Ellison, S. L., Lewis, G. F., Pettini, M., et al. 1999, PASP, 111, 946 [Google Scholar]
- Feigelson, E. D., & Nelson, P. I. 1985, ApJ, 293, 192 [NASA ADS] [CrossRef] [Google Scholar]
- Ferland, G. J. 1986, ApJ, 310, L67 [Google Scholar]
- Ferland, G. J., Korista, K. T., Verner, D. A., et al. 1998, PASP, 110, 761 [Google Scholar]
- Feruglio, C., Maiolino, R., Piconcelli, E., et al. 2010, A&A, 518, L155 [NASA ADS] [CrossRef] [EDP Sciences] [Google Scholar]
- Filiz Ak, N., Brandt, W. N., Hall, P. B., et al. 2013, ApJ, 777, 168 [NASA ADS] [CrossRef] [Google Scholar]
- Ganguly, R., Eracleous, M., Charlton, J. C., & Churchill, C. W. 1999, AJ, 117, 2594 [NASA ADS] [CrossRef] [Google Scholar]
- Gaskell, C. M., & Peterson, B. M. 1987, ApJS, 65, 1 [NASA ADS] [CrossRef] [Google Scholar]
- Gianolli, V. E., Kim, D. E., Bianchi, S., et al. 2023, MNRAS, 523, 4468 [NASA ADS] [CrossRef] [Google Scholar]
- Gibson, R. R., Brandt, W. N., Schneider, D. P., & Gallagher, S. C. 2008, ApJ, 675, 985 [NASA ADS] [CrossRef] [Google Scholar]
- Gibson, R. R., Jiang, L., Brandt, W. N., et al. 2009, ApJ, 692, 758 [Google Scholar]
- Gibson, R. R., Brandt, W. N., Gallagher, S. C., Hewett, P. C., & Schneider, D. P. 2010, ApJ, 713, 220 [Google Scholar]
- Green, K. S., Gallagher, S. C., Leighly, K. M., et al. 2023, ApJ, 953, 186 [Google Scholar]
- Grier, C. J., Hall, P. B., Brandt, W. N., et al. 2015, ApJ, 806, 111 [Google Scholar]
- Hall, P. B., Anosov, K., White, R. L., et al. 2011, MNRAS, 411, 2653 [NASA ADS] [CrossRef] [Google Scholar]
- Hamann, F. 1998, ApJ, 500, 798 [NASA ADS] [CrossRef] [Google Scholar]
- Hamann, F., & Ferland, G. 1999, ARA&A, 37, 487 [Google Scholar]
- Hamann, F., Tripp, T. M., Rupke, D., & Veilleux, S. 2019, MNRAS, 487, 5041 [Google Scholar]
- Harutyunyan, A., Rainer, M., Hernandez, N., et al. 2018, SPIE Conf. Ser., 10706, 1070642 [Google Scholar]
- Hewett, P. C., & Foltz, C. B. 2003, AJ, 125, 1784 [NASA ADS] [CrossRef] [Google Scholar]
- HI4PI Collaboration (Ben Bekhti, N., et al.) 2016, A&A, 594, A116 [NASA ADS] [CrossRef] [EDP Sciences] [Google Scholar]
- Hopkins, P. F., & Elvis, M. 2010, MNRAS, 401, 7 [NASA ADS] [CrossRef] [Google Scholar]
- Isobe, T., Feigelson, E. D., & Nelson, P. I. 1986, ApJ, 306, 490 [Google Scholar]
- Ji, T., Zhou, H., Jiang, P., et al. 2015, ApJ, 800, 56 [Google Scholar]
- Kaastra, J. S., Mewe, R., Liedahl, D. A., Komossa, S., & Brinkman, A. C. 2000, A&A, 354, L83 [NASA ADS] [Google Scholar]
- Kaspi, S., & Behar, E. 2006, ApJ, 636, 674 [Google Scholar]
- Krongold, Y., Binette, L., & Hernández-Ibarra, F. 2010, ApJ, 724, L203 [NASA ADS] [CrossRef] [Google Scholar]
- Lamer, G., Uttley, P., & McHardy, I. M. 2003, MNRAS, 342, L41 [NASA ADS] [CrossRef] [Google Scholar]
- Landt, H., Bentz, M. C., Ward, M. J., et al. 2008, ApJS, 174, 282 [NASA ADS] [CrossRef] [Google Scholar]
- Landt, H., Elvis, M., Ward, M. J., et al. 2011, MNRAS, 414, 218 [NASA ADS] [CrossRef] [Google Scholar]
- Landt, H., Ward, M. J., Kynoch, D., et al. 2019, MNRAS, 489, 1572 [NASA ADS] [CrossRef] [Google Scholar]
- Leighly, K. M., Dietrich, M., & Barber, S. 2011, ApJ, 728, 94 [Google Scholar]
- Leighly, K. M., Terndrup, D. M., Baron, E., et al. 2014, ApJ, 788, 123 [NASA ADS] [CrossRef] [Google Scholar]
- Liu, B., Zhou, H.-Y., Shu, X.-W., et al. 2021, Res. Astron. Astrophys., 21, 065 [Google Scholar]
- Liu, W.-J., Zhou, H.-Y., Jiang, N., et al. 2016, ApJ, 822, 64 [Google Scholar]
- Lundgren, B. F., Wilhite, B. C., Brunner, R. J., et al. 2007, ApJ, 656, 73 [Google Scholar]
- Lynden-Bell, D. 1969, Nature, 223, 690 [NASA ADS] [CrossRef] [Google Scholar]
- Lynds, C. R. 1967, ApJ, 147, 396 [NASA ADS] [CrossRef] [Google Scholar]
- Lyu, J., & Rieke, G. H. 2021, ApJ, 912, 126 [NASA ADS] [CrossRef] [Google Scholar]
- Mao, J., Kriss, G. A., Landt, H., et al. 2022, ApJ, 940, 41 [NASA ADS] [CrossRef] [Google Scholar]
- Marconi, A., Risaliti, G., Gilli, R., et al. 2004, MNRAS, 351, 169 [Google Scholar]
- Martín-Navarro, I., Brodie, J. P., Romanowsky, A. J., Ruiz-Lara, T., & van de Ven, G. 2018, Nature, 553, 307 [Google Scholar]
- Matzeu, G. A., Brusa, M., Lanzuisi, G., et al. 2023, A&A, 670, A182 [Google Scholar]
- Mayall, N. U. 1934, PASP, 46, 134 [NASA ADS] [CrossRef] [Google Scholar]
- Middei, R., Marinucci, A., Braito, V., et al. 2022, MNRAS, 514, 2974 [NASA ADS] [CrossRef] [Google Scholar]
- Osterbrock, D. E., & Ferland, G. J. 2006, Astrophysics of Gaseous Nebulae and Active Galactic Nuclei (Sausalito, CA: University Science Books) [Google Scholar]
- Piconcelli, E., Jimenez-Bailón, E., Guainazzi, M., et al. 2005, A&A, 432, 15 [NASA ADS] [CrossRef] [EDP Sciences] [Google Scholar]
- Polletta, M., Tajer, M., Maraschi, L., et al. 2007, ApJ, 663, 81 [NASA ADS] [CrossRef] [Google Scholar]
- Rayner, J. T., Toomey, D. W., Onaka, P. M., et al. 2003, PASP, 115, 362 [NASA ADS] [CrossRef] [Google Scholar]
- Rayner, J., Tokunaga, A., Jaffe, D., et al. 2022, PASP, 134, 015002 [NASA ADS] [CrossRef] [Google Scholar]
- Richards, G. T., Lacy, M., Storrie-Lombardi, L. J., et al. 2006, ApJS, 166, 470 [Google Scholar]
- Rosales-Ortega, F. F., Arribas, S., & Colina, L. 2012, A&A, 539, A73 [NASA ADS] [CrossRef] [EDP Sciences] [Google Scholar]
- Saturni, F. G., Trevese, D., Vagnetti, F., Perna, M., & Dadina, M. 2016, A&A, 587, A43 [NASA ADS] [CrossRef] [EDP Sciences] [Google Scholar]
- Saturni, F. G., Vietri, G., Piconcelli, E., et al. 2021, A&A, 654, A154 [NASA ADS] [CrossRef] [EDP Sciences] [Google Scholar]
- Savage, B. D., & Sembach, K. R. 1991, ApJ, 379, 245 [NASA ADS] [CrossRef] [Google Scholar]
- Shakura, N. I., & Sunyaev, R. A. 1973, A&A, 24, 337 [NASA ADS] [Google Scholar]
- Spitzer, L. 1998, Physical Processes in the Interstellar Medium (WILEY-VCH Verlag GmbH& Co, KGaA) [Google Scholar]
- Springel, V., White, S. D. M., Jenkins, A., et al. 2005, Nature, 435, 629 [Google Scholar]
- Tody, D. 1986, SPIE Conf. Ser., 627, 733 [Google Scholar]
- Tombesi, F., Cappi, M., Reeves, J. N., et al. 2010, A&A, 521, A57 [NASA ADS] [CrossRef] [EDP Sciences] [Google Scholar]
- Tombesi, F., Cappi, M., Reeves, J. N., & Braito, V. 2012, MNRAS, 422, L1 [Google Scholar]
- Trevese, D., Saturni, F. G., Vagnetti, F., et al. 2013, A&A, 557, A91 [NASA ADS] [CrossRef] [EDP Sciences] [Google Scholar]
- Vietri, G., Misawa, T., Piconcelli, E., et al. 2022, A&A, 668, A87 [NASA ADS] [CrossRef] [EDP Sciences] [Google Scholar]
- Warmels, R. H. 1992, ASP Conf. Ser., 25, 115 [Google Scholar]
- Weiss, A. W. 1967, J. Res. Natl. Bur. Stand. A. Phys. Chem., 71A, 163 [Google Scholar]
- Weymann, R. J., Morris, S. L., Foltz, C. B., & Hewett, P. C. 1991, ApJ, 373, 23 [NASA ADS] [CrossRef] [Google Scholar]
- Wildy, C., Landt, H., Goad, M. R., Ward, M., & Collinson, J. S. 2016, MNRAS, 461, 2085 [CrossRef] [Google Scholar]
- Wildy, C., Landt, H., Ward, M. J., Czerny, B., & Kynoch, D. 2021, MNRAS, 500, 2063 [Google Scholar]
- Xu, X., Heckman, T., Henry, A., et al. 2023, ApJ, 948, 28 [NASA ADS] [CrossRef] [Google Scholar]
- Zhang, S., Zhou, H., Shi, X., et al. 2017, ApJ, 845, 126 [NASA ADS] [CrossRef] [Google Scholar]
The assumption of total coverage for the outflow may lead to more severe underestimates of the absorption intensity in case of very different – and varying – partial coverages for the various AGN emitting components (e.g. Hamann 1998; Ganguly et al. 1999; Arav et al. 2005; Green et al. 2023); in such cases, the analysis of which is beyond the scope of this paper, all the He I absorption strengths computed in the following should be interpreted as lower limits on the real values.
The correction for the systematic widening due to the instrument resolving power is ≲6 km s−1 in the high-resolution spectra, to be compared with the 150–600 km s−1 of the low-resolution ones.
The same duration of the time interval holds for both the observer frame and the rest frame, given the NGC 4151 low redshift of z = 0.0033.
All Tables
Journal of observations. The signal-to-noise (S/N) ratios of each resulting spectrum were computed according to the prescriptions listed in Rosales-Ortega et al. (2012).
Summary of the relevant physical properties of the He I outflow detected in the NGC 4151 IR spectrum.
All Figures
|
Fig. 1. NGC 4151 high-resolution spectra around the He Iλ10 830 Å emission feature in the observer frame. In each panel, the instrument and epoch of acquisition is indicated (see legends), along with both the zero-flux level (dotted lines) and the position of the He I transition in the observer frame (dashed line). The different flux levels are due to the lack of an inter-calibration among the spectra. |
| In the text | |
|
Fig. 2. Top panel: rest frame NGC 4151 low-resolution spectrum taken with IRTF/SpeX on 2020 May 19. Middle panel: spectrum taken with IRTF/SpeX on 2021 February 1. Bottom panel: spectrum taken with TNG/NICS on 2022 June 15. In all panels, the best fit to the continuum emission (solid red line) is shown superimposed to the data (solid black line) along with the host-galaxy template spectrum (dotted blue line), the AGN power law (short-dashed green line) and the two BB components (long-short-dashed magenta line and dot-dashed yellow line). The major IR emission lines (Landt et al. 2008) are labelled. As per the high-resolution spectra, the different flux levels are due to the lack of an inter-calibration procedure. |
| In the text | |
|
Fig. 3. Rest-frame best-fit profiles of the He I+Paγ blended emission around 1.08 μm. Top panel: 2020 May 18 epoch. Middle panel: 2021 January 31 epoch. Bottom panel: 2022 May 20 epoch. In all panels, the total unabsorbed emission profile (solid red line) is shown superimposed to the data (solid black line), along with the continuum flux level (dot-dashed purple line) and the emission components adopted for the line decomposition (dashed lines). In addition, both the zero-flux level (dotted black line) and the masked region (grey band) are indicated. |
| In the text | |
|
Fig. 4. Top panel: spectral decomposition of the He I absorption at high resolution in the 2020 epoch. Middle panel: same as for the 2021 epoch. Bottom panel: same as for the 2022 epoch. In the bottom panel, the masks applied to the narrow absorption features mounted on top of the broad He I trough (grey bands) are shown. In all panels, both the emission level normalised to the pseudo-continuum model and the zero-velocity position (dashed black lines) are indicated, and the total absorption model (dashed red line) is plotted along with the single absorption components (dot-dashed lines). |
| In the text | |
|
Fig. 5. Time variability of the NGC 4151 He Iλ10 830 absorption parameters. Left panel: column density of neutral helium atoms in the 23S state. Middle panel: velocity blueshifts. Right panel: FWHMs of each absorption component. In all panels, the three components of the He I absorption system are identified by the same colours and symbols (see legend). |
| In the text | |
|
Fig. 6. Multi-epoch evolution of NGC 4151 X-ray parameters compared to the He I column density, along with the corresponding 1σ uncertainties. Top panel: soft X-ray flux |
| In the text | |
|
Fig. 7. Evolution of He I column density over 20 years of IR spectroscopic observations of NGC 4151. Epochs before MJD = 58000 are taken from Wildy et al. (2016). Upper limits (black arrows) are computed at a 2σ confidence level. The average of the significant He I measurements (dot-dashed line), along with its 1σ uncertainty (dashed line), is indicated. |
| In the text | |
Current usage metrics show cumulative count of Article Views (full-text article views including HTML views, PDF and ePub downloads, according to the available data) and Abstracts Views on Vision4Press platform.
Data correspond to usage on the plateform after 2015. The current usage metrics is available 48-96 hours after online publication and is updated daily on week days.
Initial download of the metrics may take a while.