


Fig. C.2
Download original image
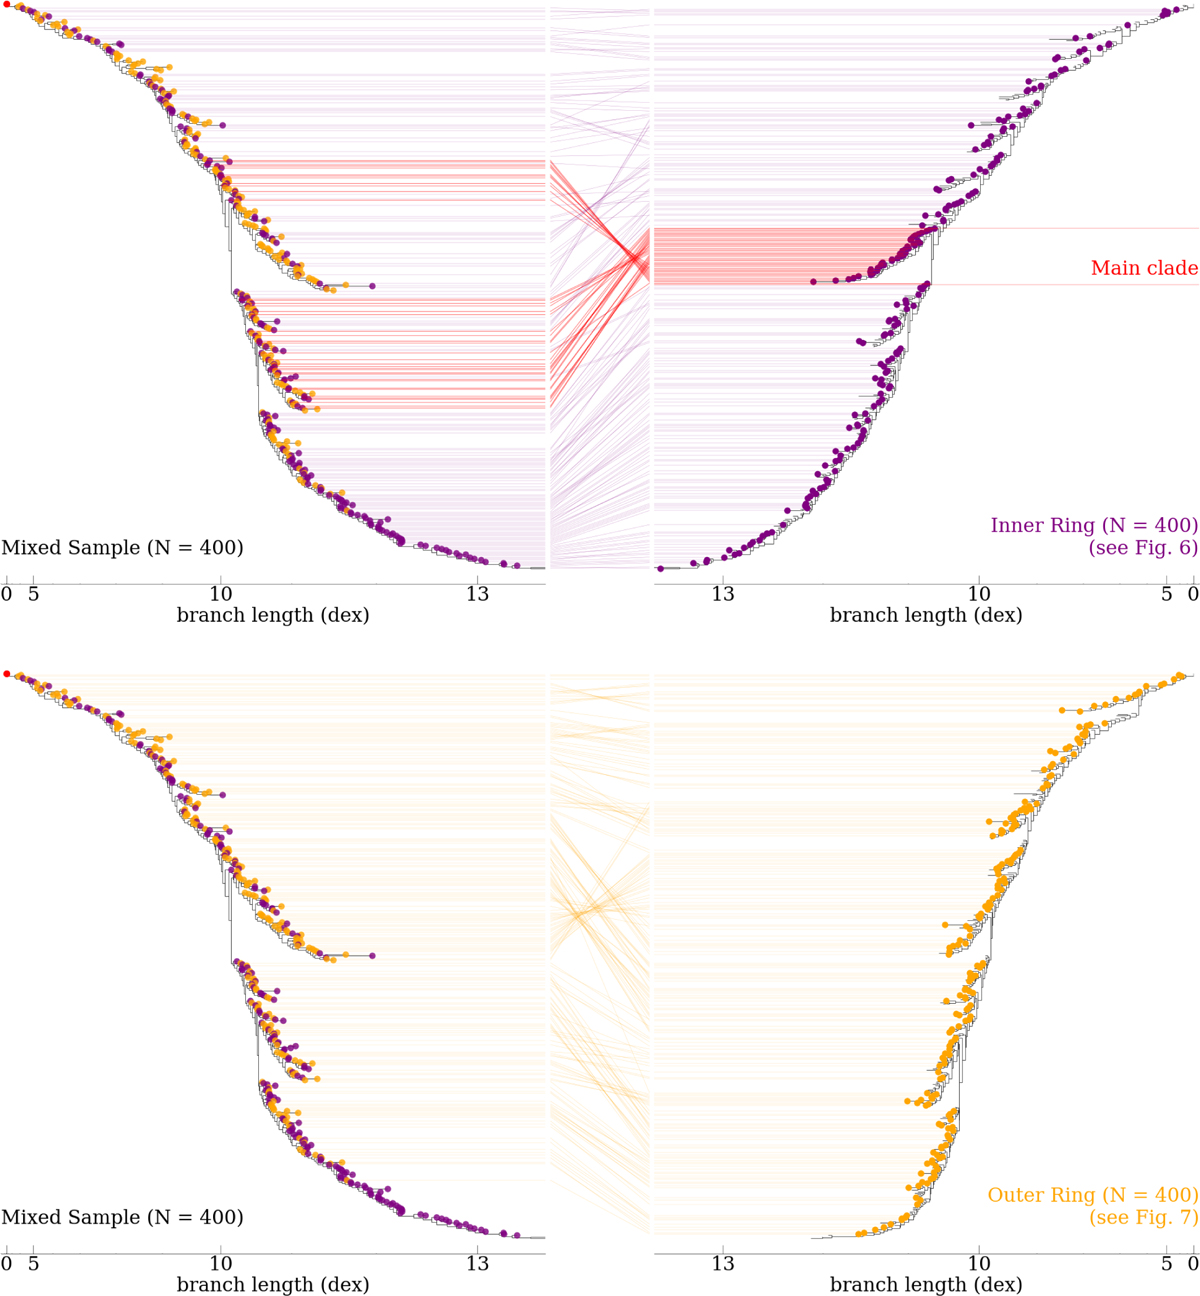
Phylogenetic trees of the mixed sample (left panels) compared to the original inner-ring (upper right panel) and outer-ring (lower right panel) trees. Points are colour-coded according to their region of origin (purple: inner ring; orange: outer ring). In the right panels, coloured points highlight the particles selected to construct the mixed tree. Red lines indicate the members of the main clade in the original inner-ring tree. The central panels show the correspondence between the positions of the selected particles in the original trees and their rearrangement in the mixed tree.
Current usage metrics show cumulative count of Article Views (full-text article views including HTML views, PDF and ePub downloads, according to the available data) and Abstracts Views on Vision4Press platform.
Data correspond to usage on the plateform after 2015. The current usage metrics is available 48-96 hours after online publication and is updated daily on week days.
Initial download of the metrics may take a while.