


Fig. 7.
Download original image
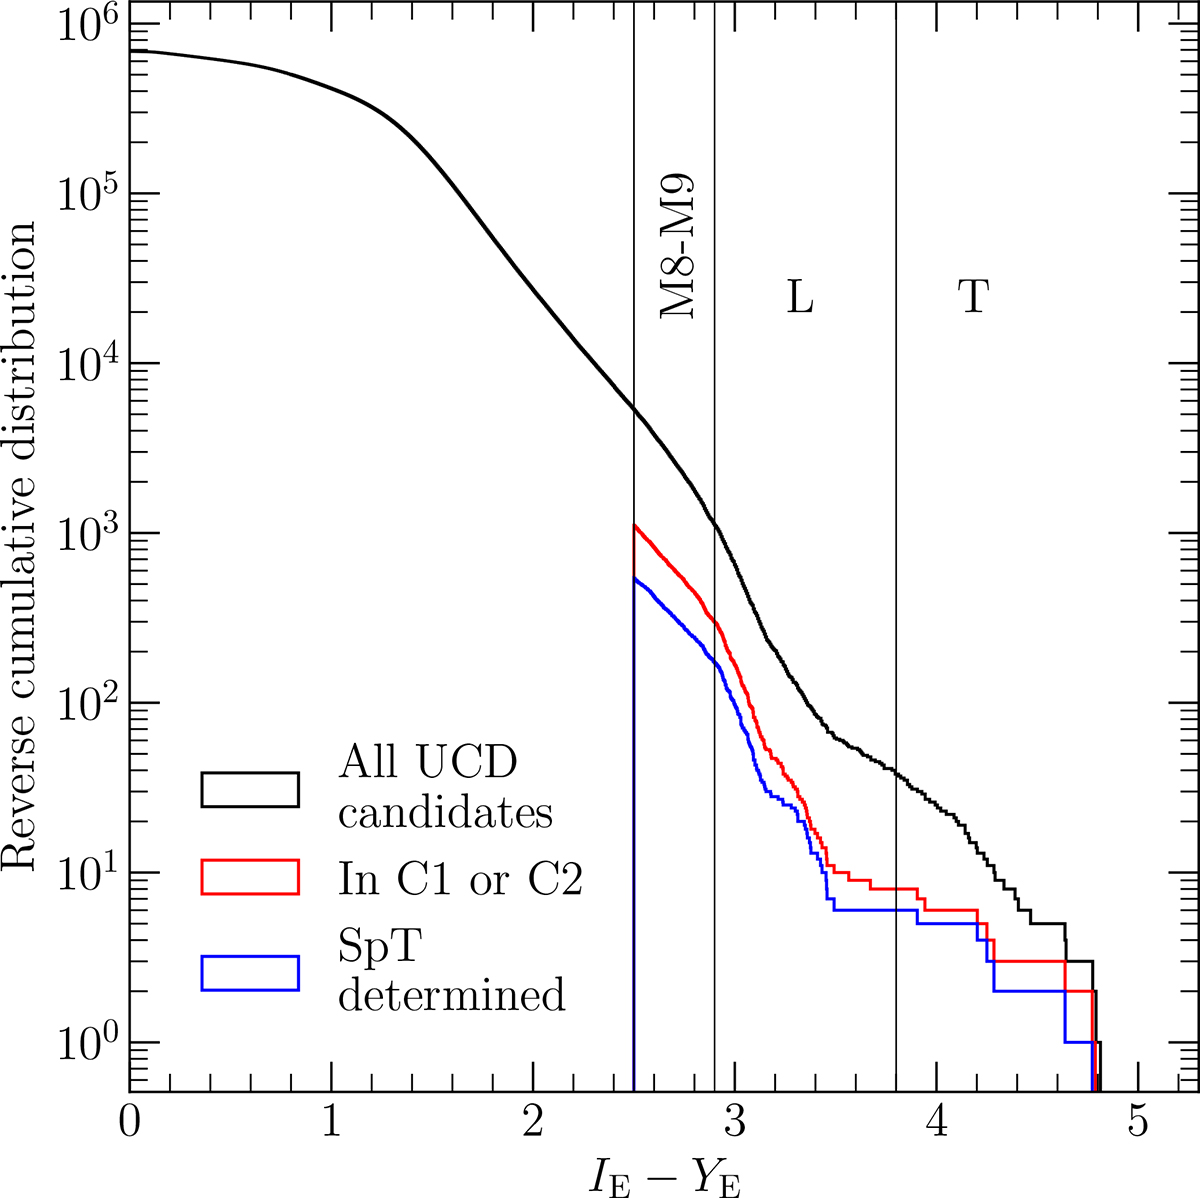
Reverse cumulative distribution, showing how many objects are redder than the selected colour. There are 5306 objects redder than 2.5, which correspond to late M dwarfs, and 1200 objects redder than 2.9, which roughly correspond to L0 dwarfs. The red curve corresponds to objects whose spectra exhibit UCD features, whereas the blue line corresponds to objects with assigned spectral types.
Current usage metrics show cumulative count of Article Views (full-text article views including HTML views, PDF and ePub downloads, according to the available data) and Abstracts Views on Vision4Press platform.
Data correspond to usage on the plateform after 2015. The current usage metrics is available 48-96 hours after online publication and is updated daily on week days.
Initial download of the metrics may take a while.