


Fig. 5.
Download original image
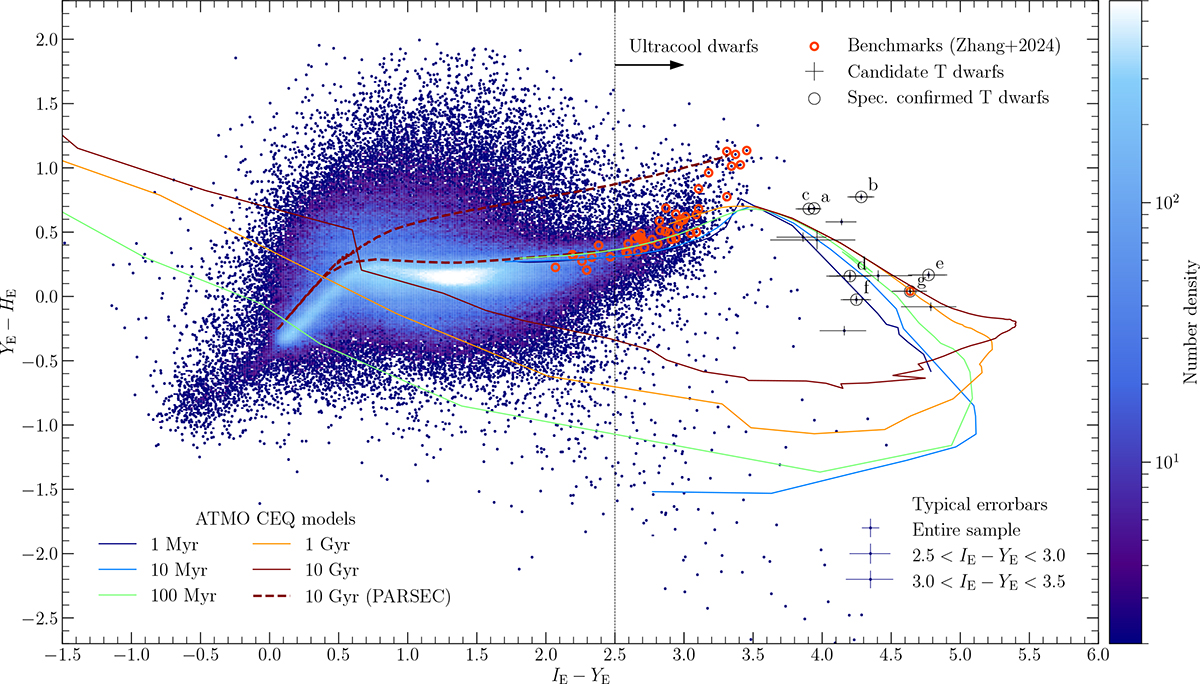
Bluebottle diagram of point sources. The central sequence starts with white dwarfs below IE − YE < 0, continues with stars, and ends in the cool tip with UCDs at IE − YE ≳ 2.5. Their nature is confirmed with the benchmark UCDs from Zhang et al. (2024). We overplotted both the new photometric candidate T dwarfs from this work (symbols with error bars), and those that were spectroscopically confirmed (open circles), as listed in Table A.2. ATMO models (Phillips et al. 2020) indicate the UCD parameter space, while the PARSEC model traces main sequence and evolved stars with redder YE − HE.
Current usage metrics show cumulative count of Article Views (full-text article views including HTML views, PDF and ePub downloads, according to the available data) and Abstracts Views on Vision4Press platform.
Data correspond to usage on the plateform after 2015. The current usage metrics is available 48-96 hours after online publication and is updated daily on week days.
Initial download of the metrics may take a while.