


Fig. 2.
Download original image
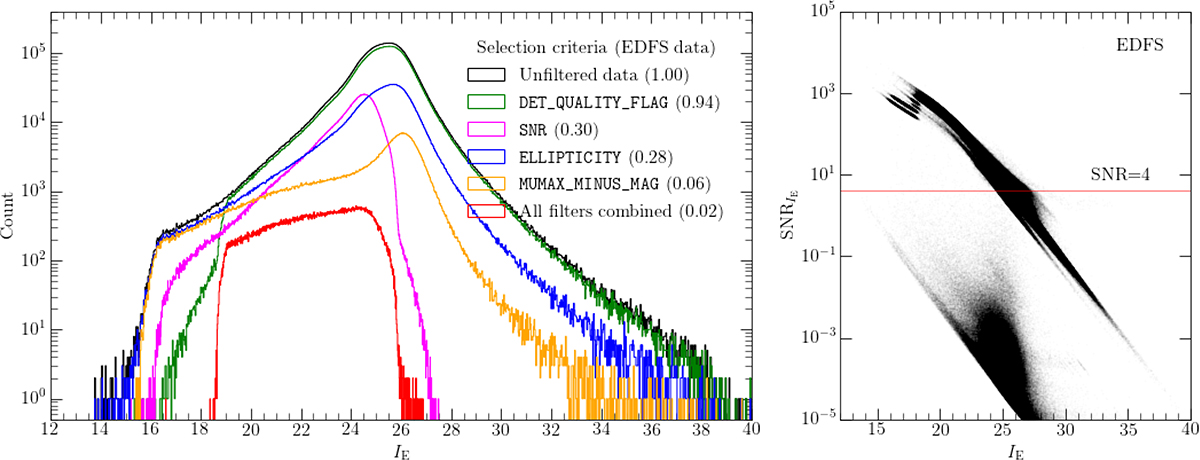
Magnitude distributions and signal-to-noise characteristics of the point-source catalogue. Left: Magnitude distributions for each point-source selection filter (we do not plot the FWHM filter). The most limiting is the S/N requirement that raises the completeness and detection limits to ensure a high quality of the point-source catalogue. Right: Signal-to-noise ratio as a function of luminosity. A cut at S/N = 4 is imposed.
Current usage metrics show cumulative count of Article Views (full-text article views including HTML views, PDF and ePub downloads, according to the available data) and Abstracts Views on Vision4Press platform.
Data correspond to usage on the plateform after 2015. The current usage metrics is available 48-96 hours after online publication and is updated daily on week days.
Initial download of the metrics may take a while.